Garmin Body Battery vs WHOOP Recovery vs Oura Readiness: How Each Calculates Your Score in 2026
Garmin, WHOOP, and Oura calculate recovery differently — different inputs, different windows, different answers. Here's exactly what each score measures, how they compare, and which one to trust.
SensAI Team
13 min read
Get a training plan that adapts to your recovery — free on iOS
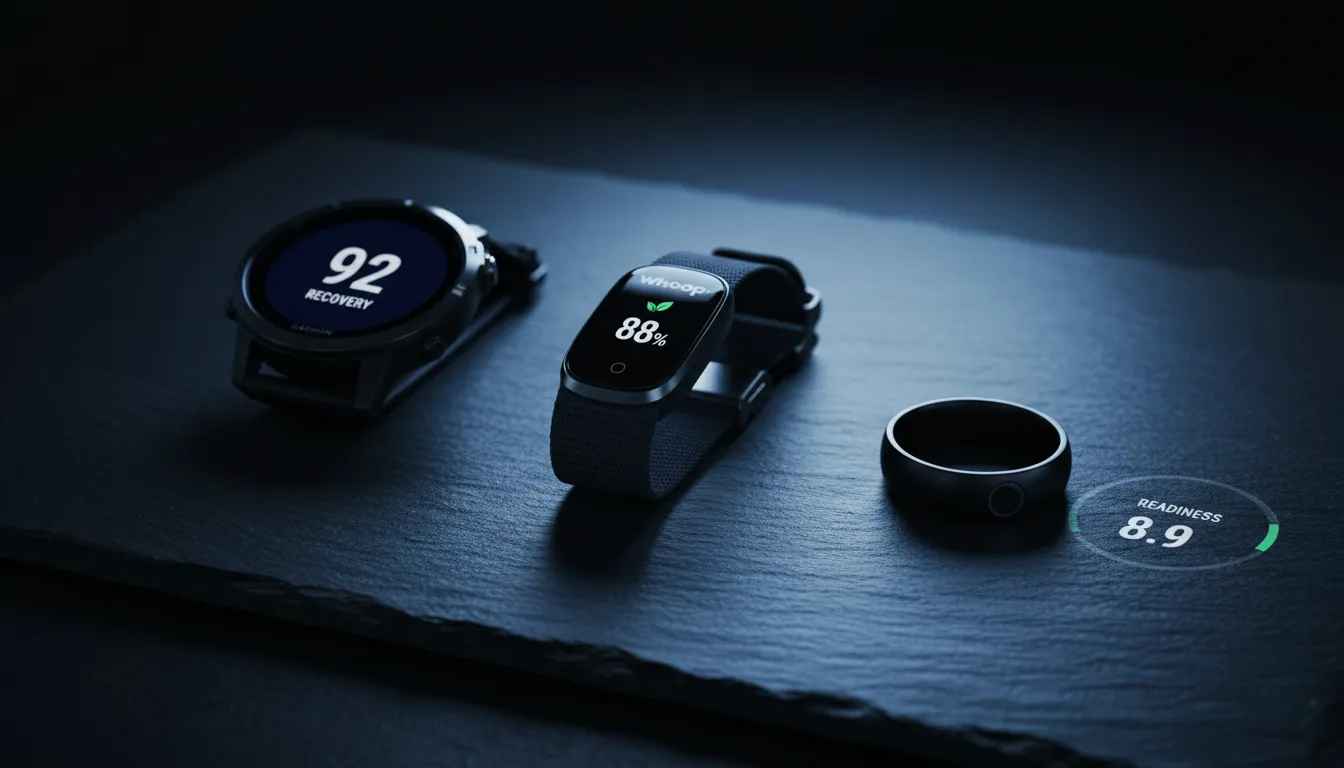
You check three devices before your feet hit the floor. Garmin Body Battery says 35. WHOOP Recovery shows 84% green. Oura Readiness reads 62.
One device says you’re running on fumes. Another says you’re primed to crush it. The third is somewhere in between. This isn’t a malfunction. It’s three systems answering three fundamentally different questions about your body — and the disagreement tells you more than any single score ever could.
These scores diverge because they’re built on different engines, fed different inputs, and optimized for different time horizons. Garmin tracks your energy reserve like a fuel gauge that drains across days. WHOOP snapshots your overnight autonomic recovery. Oura blends multi-day physiological trends into a readiness estimate that weighs sleep balance as heavily as heart rate variability.
The 2025 validation research makes one thing uncomfortably clear: none of the 14 composite health scores evaluated across major wearable manufacturers have undergone rigorous independent validation in the peer-reviewed literature1. That doesn’t make them useless. It means understanding what each score actually measures — and what it misses — is the difference between informed training and blind obedience to a number on your wrist.
Here’s how each one actually works, what the latest studies say about accuracy, and how to use them without letting a single score derail your training.
Garmin Body Battery: The Continuous Energy Model
Garmin Body Battery estimates your energy reserves on a scale of 5 to 100, updated continuously throughout the day and night. Think of it as a fuel tank. Sleep and rest fill it up. Stress, activity, and daily demands drain it down. The score doesn’t reset each morning — it carries forward, so a rough Monday night can follow you into Wednesday2.
Under the hood, Body Battery runs on the Firstbeat Analytics engine, a platform Garmin acquired in 2020. The algorithm ingests four primary data streams: stress level (derived from HRV), sleep quality and duration, physical activity intensity and duration, and rest periods throughout the day2. The model combines these into a continuous energy estimate using what Garmin describes as a physiological load and recovery calculation3.
The key differentiator is that measurement window. Garmin doesn’t just look at your night. It tracks energy flow in real time — a stressful afternoon meeting will visibly drain your battery, and a 20-minute nap will add points back. This gives Body Battery a responsiveness that overnight-only models lack, but it also means the score can fluctuate in ways that feel noisy if you’re looking for a single morning readiness number.
The decay characteristic matters for training decisions. Because Body Battery incorporates a multi-day energy model, a hard training block followed by one decent night of sleep may not fully restore your score. The model accounts for accumulated load over multiple days2. That’s useful for catching cumulative fatigue, but it can also feel sluggish if you genuinely bounced back overnight.
In the Dial et al. 2025 validation study comparing overnight HRV accuracy across consumer wearables against ECG reference measurements, Garmin ranked behind both Oura (CCC = 0.99) and WHOOP (CCC = 0.94) for HRV measurement precision, with a concordance correlation of 0.874. That doesn’t mean Body Battery is unreliable — it means the HRV input feeding the algorithm carries slightly more noise than its competitors.
Where Body Battery shines is the all-day energy narrative. No other consumer wearable gives you a continuous, real-time estimate of physiological resources that you can check at 2 PM before deciding whether to hit the gym after work or go to bed early.
WHOOP Recovery: The Overnight Autonomic Snapshot
WHOOP Recovery distills your overnight physiology into a single 0-100% score, color-coded green (67%+), yellow (34-66%), or red (0-33%). It’s designed to answer one specific question each morning: how ready is your cardiovascular and autonomic system to handle stress today?5
The algorithm weighs four primary inputs: resting heart rate (RHR), heart rate variability (specifically rMSSD, the root mean square of successive differences), respiratory rate, and sleep performance as a percentage of your sleep need5. With the WHOOP 5.0 hardware released in 2025, skin temperature and SpO2 were added to the sensor suite, expanding the available physiological data the platform can incorporate6.
Here’s what makes WHOOP Recovery distinct: HRV carries outsized influence. A data analysis published by Sportsmith — using real-world concurrent WHOOP and Oura data — found that HRV alone explains approximately 56% of the variance in WHOOP Recovery scores7. That means more than half of your Recovery score is driven by a single metric. When your HRV is high, Recovery is almost certainly green. When HRV drops, Recovery follows.
This isn’t necessarily a weakness. HRV is the single most sensitive non-invasive marker of autonomic nervous system status, and research from Dr. Daniel Plews at Auckland University of Technology demonstrated that HRV-guided training produced better endurance outcomes than fixed training plans8. If you’re going to weight one metric heavily, HRV is a defensible choice.
But it does mean WHOOP Recovery is essentially an HRV score with supporting context. If you slept terribly but your HRV recovered (which happens — especially for younger, fitter athletes), WHOOP may still give you a green score. Conversely, one night of elevated sympathetic tone from caffeine or alcohol can tank your Recovery even if every other recovery indicator looks fine.
In the Dial 2025 validation, WHOOP achieved a concordance correlation coefficient of 0.94 for overnight HRV against ECG reference — second only to Oura4. The measurement window is exclusively overnight — WHOOP doesn’t attempt to track daytime recovery or real-time energy state the way Garmin does.
WHOOP’s strength is its simplicity and the depth of its sleep analytics. The platform calculates your individual sleep need (not a generic 8-hour target) and reports sleep performance as a percentage of that need. For athletes who want a clean, HRV-forward morning readiness signal with actionable sleep data, it’s hard to beat.
Oura Readiness: The Multi-Day Trend Integrator
Oura Readiness generates a 0-100 score by blending seven distinct contributors: resting heart rate, HRV balance, body temperature deviation, recovery index (how quickly your resting heart rate stabilizes overnight), sleep score, sleep balance (recent sleep debt), and previous day activity9. It’s the most multi-dimensional readiness model of the three.
The surprise from the Sportsmith analysis is that HRV explains less than 5% of the variance in Oura Readiness scores7. Read that again. While WHOOP Recovery is 56% HRV, Oura Readiness is less than 5% HRV.
That’s not a flaw — it’s a design decision. Oura deliberately distributes influence across multiple physiological signals and multi-day trends. Your Readiness score reflects not just last night’s autonomic state, but whether you’ve been sleeping enough over the past two weeks, whether your body temperature is deviating from baseline, and whether yesterday’s activity demands were appropriate for your recent recovery trajectory9.
This design philosophy means Oura Readiness captures things the other two miss entirely. Cumulative sleep debt? Oura tracks it. Early signs of illness via temperature deviation? Oura catches it. The tradeoff is that Oura Readiness can feel disconnected from your overnight HRV — you might see a great HRV reading but a mediocre Readiness score because your sleep balance is in deficit.
With the Oura Ring 4 — featuring an 18-path multi-wavelength PPG system and Smart Sensing technology — Oura added enhanced daytime heart rate monitoring and improved temperature sensing, expanding the data resolution feeding the Readiness algorithm10.
In the Dial 2025 validation, Oura Ring 4 achieved the highest concordance correlation (CCC = 0.99) for overnight HRV measurement against ECG reference4. The ring form factor places the optical sensor on the palmar side of the finger, which provides a cleaner arterial signal than wrist-based photoplethysmography. But Oura’s Readiness score intentionally de-emphasizes that accurate HRV reading in favor of a broader physiological picture.
Oura’s strength is its multi-day context and temperature tracking. For users who want a readiness score that accounts for cumulative life stress — not just last night’s autonomic snapshot — it’s the most holistic option.
The Comparison Table
| Dimension | Garmin Body Battery | WHOOP Recovery | Oura Readiness |
|---|---|---|---|
| Score range | 5-100 (energy) | 0-100% (green/yellow/red) | 0-100 (readiness) |
| Primary inputs | Stress, HRV, sleep, activity, rest | rMSSD HRV, RHR, respiratory rate, sleep performance | RHR, HRV balance, temperature, recovery index, sleep, sleep balance, previous activity |
| Measurement window | Continuous (24/7) | Overnight only | Overnight + multi-day trends |
| HRV weight in score | Moderate (via stress metric) | High (~56% of variance) | Low (<5% of variance) |
| HRV accuracy rank (Dial 2025) | #3 | #2 | #1 |
| Unique strength | Real-time energy tracking, all-day updates | HRV-forward autonomic clarity, individual sleep need | Multi-day trend context, temperature deviation |
| Key limitation | Noisier HRV input, can feel sluggish to recover | Over-reliant on single-night HRV | Can feel disconnected from overnight HRV |
| Best for | All-day energy management, understanding when fatigue accumulates | Athletes who want a clean, HRV-driven morning readiness signal | Users who need readiness that accounts for cumulative stress and sleep debt |
The pattern is clear: these aren’t three attempts at the same answer. They’re three different instruments measuring three overlapping but distinct aspects of recovery. Garmin is a fuel gauge. WHOOP is a cardiovascular readiness thermometer. Oura is a multi-system trend monitor.
That’s why a platform like SensAI that ingests data from all three — via Apple Health — can synthesize a more complete readiness picture than any single device provides alone. Each device contributes what it does best, and the AI layer resolves the conflicts.
Why Do Your Devices Disagree?
Your devices disagree for three structural reasons, and none of them mean a device is broken.
Different inputs. Garmin factors in daytime stress and real-time activity drain. WHOOP leans heavily on overnight HRV. Oura blends temperature trends and multi-day sleep balance. Even if two devices measured the same physiology perfectly, feeding different variables into different algorithms produces different outputs. It’s like asking three doctors the same question — a cardiologist, a sleep specialist, and an endocrinologist — and getting three accurate but different answers.
Different time windows. Garmin’s energy model carries a multi-day decay. A hard weekend drags your Monday Body Battery down even if you slept well. WHOOP resets nightly — each Recovery score is primarily about last night’s autonomic state. Oura sits in between, blending overnight data with two-week rolling context. Same athlete, same morning, three different temporal lenses.
Different weighting. The Sportsmith data makes this concrete. HRV explains 56% of WHOOP Recovery variance but less than 5% of Oura Readiness variance7. That single difference in weighting architecture explains the majority of device disagreements. On mornings where your HRV is high but your cumulative sleep debt is heavy, WHOOP will likely read green while Oura reads yellow. Neither is wrong.
The Doherty et al. 2025 evaluation reinforces why blind trust in any single score is premature: of 14 composite health scores across 10 major wearable manufacturers, none had undergone rigorous independent validation in the peer-reviewed literature1. The scores are useful heuristics — but they’re not medical diagnoses, and treating any one of them as ground truth is a mistake. Even research on whether wearing these devices improves sleep outcomes has produced mixed results11.
This is exactly the kind of problem that multi-device synthesis solves. When you funnel Garmin, WHOOP, and Oura data into SensAI, the system doesn’t pick a winner. It reads the pattern across all three — identifying when signals converge (high confidence) and when they diverge (dig deeper into the underlying metrics).
What the 2025 Validation Studies Actually Found
Three pieces of 2025 research reshape how you should think about these scores.
The Dial et al. validation study compared overnight HRV accuracy across five consumer wearables against reference-grade ECG measurements over 536 nights4. The results ranked Oura Ring 4 first (CCC = 0.99), Oura Gen 3 second (CCC = 0.97), WHOOP third (CCC = 0.94), and Garmin fourth (CCC = 0.87) for HRV measurement precision. This matters because HRV is the most common input across all three readiness algorithms. If the underlying HRV measurement is noisier, the downstream score inherits that noise.
The Doherty et al. evaluation examined the broader landscape of composite health scores — the kinds of single-number readiness, recovery, and wellness scores that consumers actually use for training decisions1. The finding was stark: of 14 composite health scores across 10 major manufacturers, none had undergone rigorous independent validation. As Dr. Cailbhe Doherty of University College Dublin and colleagues noted, the absence of independent validation doesn’t invalidate these tools, but it should temper how much confidence you place in any single proprietary score.
The Sportsmith analysis dissected what actually drives each score’s variance using real-world concurrent data7. Finding that HRV explains 56% of WHOOP Recovery but less than 5% of Oura Readiness reveals that these aren’t minor differences in implementation — they’re fundamentally different philosophies about what “readiness” means. WHOOP is asking “how recovered is your autonomic nervous system?” while Oura is asking “how ready is your whole organism, considering recent history?”
Taken together, these studies argue for a layered interpretation strategy rather than device loyalty. The most accurate HRV data (Oura) feeds into a score that barely uses HRV. The most HRV-dependent score (WHOOP) uses the second-most accurate HRV data. And Garmin’s continuous energy model offers something neither competitor attempts — real-time tracking — built on the least precise HRV input.
No single device wins across all dimensions. That’s not a marketing cop-out — it’s the mathematical reality of how these systems are built. It’s also why platforms like SensAI that aggregate multiple wearable streams through Apple Health can triangulate a more reliable readiness signal than any one device alone.
How to Actually Use These Scores
Stop looking for the “right” device. Start reading the signal cluster.
Rule 1: When all three agree, trust the consensus. If Garmin, WHOOP, and Oura all say you’re recovered (or all say you’re not), the confidence is high. Act accordingly. When your wearable readiness scores conflict, use the underlying metrics — HRV trend, RHR drift, sleep quality — rather than the headline numbers.
Rule 2: Look beneath the score when they diverge. A green WHOOP with a low Oura Readiness probably means your overnight HRV was fine but your cumulative sleep debt or temperature trend is elevated. Don’t ignore either signal — consider the combination. Understanding how HRV functions as a fitness and recovery signal helps you weigh these inputs appropriately.
Rule 3: Match the score to the decision. Garmin Body Battery is most useful for deciding when during the day to train — checking at 3 PM whether you have enough energy for an evening session. WHOOP Recovery is most useful for deciding how hard to train in the morning. Oura Readiness is most useful for deciding whether to adjust your training plan for the week based on accumulated stress.
Rule 4: Track trends, not daily scores. A single red day means almost nothing. Five consecutive days of declining scores across multiple devices means something real is happening — overreaching signals that demand attention. Dr. Daniel Plews’ research demonstrated that HRV-guided training — adapting intensity to readiness trends — produced superior endurance outcomes compared to fixed programming8. Gabbett’s influential work on the training-injury prevention paradox reinforces this: athletes need adequate training load to build resilience, but sharp spikes in load relative to chronic training history dramatically increase injury risk12. The principle applies to all readiness metrics, not just HRV.
Best For Verdicts
Garmin Body Battery is best for athletes who want all-day energy awareness and train at variable times. If you need to know at 4 PM whether you have gas left for the gym, nothing else provides that answer.
WHOOP Recovery is best for performance-focused athletes who want a clean, HRV-driven morning readiness signal with actionable sleep analytics. If autonomic recovery is your primary decision driver, WHOOP gives it the most weight.
Oura Readiness is best for health-conscious users who prioritize cumulative recovery trends, sleep debt awareness, and early illness detection via temperature tracking. If you want the most holistic view of readiness, Oura casts the widest net.
The real answer is that using any single score means accepting that score’s blind spots. Combining data from multiple wearables into a unified AI coaching platform like SensAI eliminates the guessing game entirely. The AI reads all three signal streams, weighs them against your training history, and adjusts your programming automatically — no morning spreadsheet required.
Three devices, three philosophies, one body. The scores disagree because they should. Your job isn’t to pick a winner. It’s to read the whole picture.
References
Footnotes
-
Doherty, C., Baldwin, M., Lambe, R., Burke, D., & Altini, M. “Readiness, recovery, and strain: an evaluation of composite health scores in consumer wearables.” Translational Exercise Biomedicine, 2(2), 128-144, 2025. https://doi.org/10.1515/teb-2025-0001 ↩ ↩2 ↩3
-
Garmin. “Body Battery Energy Monitoring.” Garmin Technology — Health Science. https://www.garmin.com/en-US/garmin-technology/health-science/body-battery/ ↩ ↩2 ↩3
-
the5krunner. “Garmin Body Battery.” the5krunner.com. https://the5krunner.com/garmin-features/sleep/body-battery/ ↩
-
Dial, M. B., Hollander, M. E., Vatne, E. A., Emerson, A. M., Edwards, N. A., & Hagen, J. A. “Validation of nocturnal resting heart rate and heart rate variability in consumer wearables.” Physiological Reports, 13(16), e70527, 2025. https://doi.org/10.14814/phy2.70527 ↩ ↩2 ↩3 ↩4
-
WHOOP. “WHOOP Recovery: How It Works, Key Metrics, and Tips.” WHOOP. https://www.whoop.com/us/en/thelocker/how-does-whoop-recovery-work-101/ ↩ ↩2
-
WHOOP. “WHOOP Unveils WHOOP 5.0 and WHOOP MG.” WHOOP Press Center, 2025. https://www.whoop.com/us/en/press-center/whoop-unveils-5.0-MG/ ↩
-
Allen, S. & Tierney, P. “Whoop vs Oura Ring: Real-life data, analysis and comparisons.” Sportsmith. https://www.sportsmith.co/articles/whoop-vs-oura-ring-real-life-data-analysis-and-comparisons/ ↩ ↩2 ↩3 ↩4
-
Plews, D. J., Laursen, P. B., Stanley, J., Kilding, A. E., & Buchheit, M. “Training Adaptation and Heart Rate Variability in Elite Endurance Athletes: Opening the Door to Effective Monitoring.” Sports Medicine, 43(9), 773-781, 2013. https://doi.org/10.1007/s40279-013-0071-8 ↩ ↩2
-
Oura. “How Oura Calculates Your Readiness Score.” Oura Ring Documentation. https://ouraring.com/blog/readiness-score/ ↩ ↩2
-
Oura. “Discover the Brand-New Oura Ring 4.” Oura Blog, 2024. https://ouraring.com/blog/oura-ring-4/ ↩
-
Berryhill, S., Morton, C. J., Dean, A., Berryhill, A., Provencio-Dean, N., Patel, S. I., Estep, L., Combs, D., Mashaqi, S., Gerald, L. B., Krishnan, J. A., & Parthasarathy, S. “Effect of Wearables on Sleep in Healthy Individuals: A Randomized Crossover Trial and Validation Study.” Journal of Clinical Sleep Medicine, 16(5), 775-783, 2020. https://doi.org/10.5664/jcsm.8356 ↩
-
Gabbett, T. J. “The Training-Injury Prevention Paradox: Should Athletes Be Training Smarter and Harder?” British Journal of Sports Medicine, 50(5), 273-280, 2016. https://doi.org/10.1136/bjsports-2015-095788 ↩
Related Articles

Normal Resting Heart Rate by Age: Charts, Ranges, and What a Rising Trend on Your Wearable Means
13 min read

What Is a Good Heart Rate Recovery? How to Read the Number Your Watch Shows After a Workout
12 min read
Choosing a Wearable for an AI Coach: The 5 Data-Quality Criteria That Actually Matter
12 min read