
Overtraining vs. Overreaching: How Wearables Detect the Difference
Learn how wearable biomarkers and AI detect the overtraining continuum — from productive overreaching to OTS — using HRV, ACWR, and multi-signal analysis.
SensAI Team
12 min read
Get a training plan that adapts to your recovery — free on iOS
You pushed through a brutal training block. Performance dipped, fatigue piled up, and you assumed a rest week would fix everything. Two weeks later, you’re still slower, still tired, and starting to dread workouts you used to love. What happened?
You crossed the line from productive overreaching into something far more damaging — and you had no idea it was happening. The difference between a performance breakthrough and a months-long setback often comes down to signals your body was sending that nobody was reading.
The sports science community has mapped this progression in detail: functional overreaching leads to supercompensation, but non-functional overreaching leads to stagnation, and overtraining syndrome can sideline athletes for months or years1. The problem has never been the science. It’s been detecting which stage you’re in before it’s too late. That’s where wearable biomarkers and AI-powered coaching change the game entirely.
What Is the Difference Between Overreaching and Overtraining Syndrome?
Overreaching and overtraining syndrome sit on the same continuum but produce radically different outcomes. The European College of Sport Science and the American College of Sports Medicine define three distinct stages along this spectrum1.
Functional overreaching (FOR) is the productive kind. You intentionally push beyond your normal capacity, performance drops temporarily, and after adequate recovery — typically days to two weeks — you bounce back stronger through supercompensation. Every effective periodized program uses this deliberately2.
Non-functional overreaching (NFO) is where things go wrong. The training stress exceeds your recovery capacity, and performance declines persist for weeks to months. According to Dr. Jeffrey Kreher, a sports medicine physician at Massachusetts General Hospital, NFO often presents with mood disturbances, persistent fatigue, and disrupted sleep alongside the performance decline3. Recovery takes weeks to months instead of days.
Overtraining syndrome (OTS) is the severe end of the spectrum. Performance drops are sustained, recovery takes months or longer, and systemic issues — hormonal disruption, immune suppression, chronic fatigue — emerge1. Studies estimate that OTS affects approximately 60% of elite distance runners and up to 33% of non-elite endurance athletes at some point in their careers3.
The critical challenge is that the transition from FOR to NFO to OTS happens gradually. There is no single moment where everything breaks. By the time an athlete or coach recognizes OTS, the damage requires extended recovery that can derail an entire competitive season2.
How Does HRV Detect Overtraining Before Symptoms Appear?
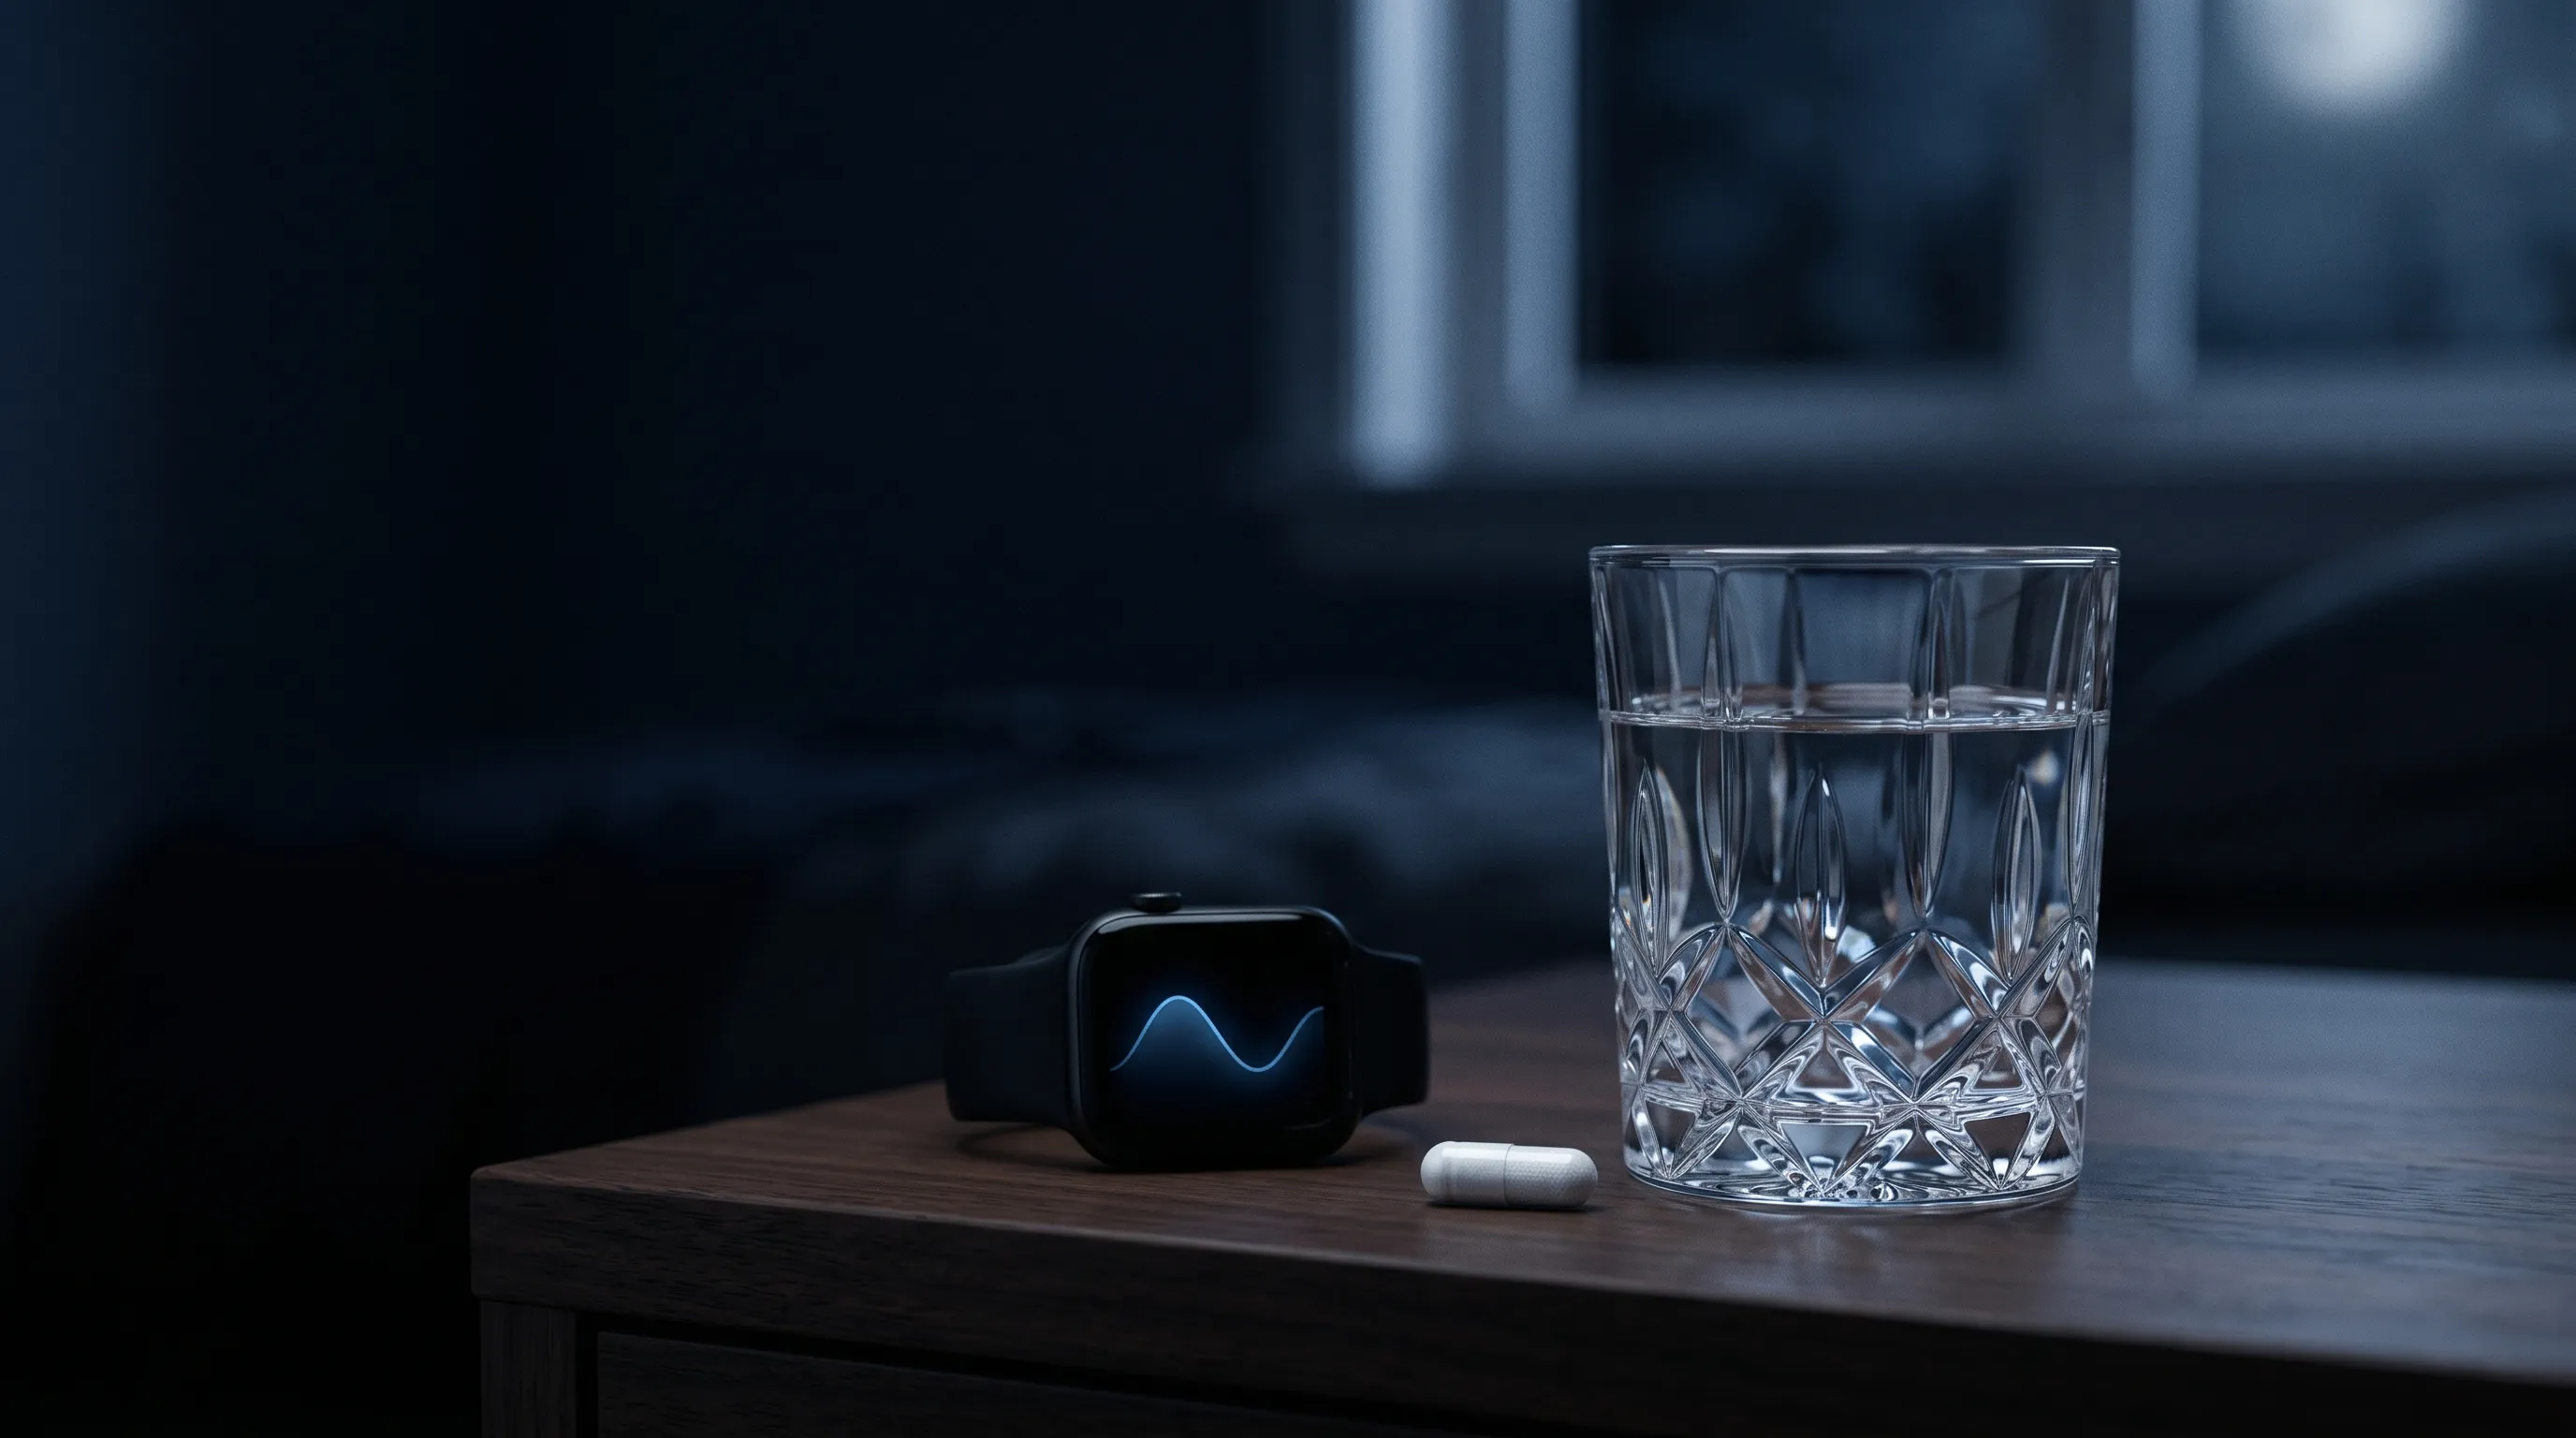
Heart rate variability is the single most sensitive wearable biomarker for detecting the shift from productive to harmful training stress. HRV measures the variation in time between consecutive heartbeats, reflecting autonomic nervous system balance. Higher HRV generally indicates parasympathetic dominance — recovery and readiness. Lower HRV signals sympathetic dominance — accumulated stress4.
Dr. Daniel Plews, a researcher in exercise physiology at Auckland University of Technology, demonstrated that HRV-guided training produced superior endurance outcomes compared to predetermined training plans. In a landmark 2013 study, recreational runners who adjusted intensity based on daily HRV improved their 10K times while athletes following a fixed plan did not see equivalent gains4. The HRV-guided group trained harder on days their bodies were ready and backed off on days they were not — without any conscious decision-making required.
What makes HRV particularly powerful for overtraining detection is the pattern shift. During functional overreaching, HRV typically shows acute suppression that recovers within 48-72 hours. During non-functional overreaching, the suppression persists beyond normal recovery windows, and the coefficient of variation in daily HRV readings increases — meaning readings become erratic rather than simply low5. In established overtraining syndrome, HRV can paradoxically increase due to excessive parasympathetic tone, which is why single-metric thresholds fail and trend analysis matters1.
This is exactly why apps like SensAI track HRV trends over weeks, not just daily readings. A single low HRV morning means little. Seven consecutive days of declining HRV with increasing day-to-day variability is a red flag that demands immediate training adjustment.
What Is the Acute-to-Chronic Workload Ratio and Why Does It Matter?
The acute-to-chronic workload ratio (ACWR) is a training load metric that compares your recent training stress (typically the last 7 days) against your longer-term training baseline (typically 28 days). Developed by sports scientist Dr. Tim Gabbett and published in the British Journal of Sports Medicine, the ACWR framework provides a quantifiable way to assess injury and overtraining risk6.
An ACWR between 0.8 and 1.3 is generally considered the “sweet spot” — enough training stimulus to drive adaptation without excessive injury risk6. When the ratio exceeds 1.5, injury risk increases significantly. Research across multiple sports found that athletes with an ACWR above 1.5 had a 2-4 times higher likelihood of injury compared to those in the optimal range6.
The power of ACWR lies in its simplicity: it catches dangerous spikes in training load relative to what you’ve been doing. Someone who runs 20 kilometers per week and suddenly jumps to 40 has an ACWR of 2.0 — well into the danger zone. But someone who has been building from 30 to 35 to 38 over months can handle 40 safely because their chronic load supports it.
Traditional training apps don’t calculate ACWR because it requires continuous tracking of both internal load (heart rate, RPE) and external load (volume, distance, weight moved) across weeks. AI-powered platforms like SensAI maintain this running calculation automatically, flagging when your recent training is spiking relative to what your body has adapted to handle.
What Biomarker Patterns Distinguish Each Stage of the Overtraining Continuum?
Each stage of the overreaching-to-OTS continuum produces distinct, measurable biomarker signatures that wearables can detect — if you know what to look for.
During functional overreaching, resting heart rate may elevate by 3-5 beats per minute above baseline. HRV dips acutely but recovers within 24-72 hours after a rest day. Sleep architecture stays relatively normal, though time to fall asleep may increase slightly. Training performance drops 5-10% but rebounds with 1-2 weeks of reduced loading2.
During non-functional overreaching, the pattern shifts. Resting heart rate elevates persistently — staying 5-10 bpm above baseline even on rest days. HRV suppression lasts beyond typical recovery windows, and the day-to-day variability in HRV readings increases by 20-30% compared to baseline5. Sleep disturbances become measurable: reduced deep sleep percentage, increased nighttime awakenings, and elevated overnight respiratory rate. Performance declines of 10-20% persist for weeks despite rest3.
During overtraining syndrome, paradoxical shifts emerge. HRV may actually increase beyond normal baseline due to parasympathetic saturation — the autonomic nervous system essentially overcorrects1. Resting heart rate can normalize or even decrease while the athlete remains profoundly fatigued. Sleep quality deteriorates further, with some research showing a 25-40% reduction in slow-wave sleep3. The hormonal axis is disrupted, with research documenting blunted cortisol responses to exercise — the stress system stops responding appropriately to training stimuli2.
This is why a single metric never tells the full story. An athlete in early OTS might show “normal” HRV on a given day while their sleep data, resting heart rate trends, and performance trajectory all signal breakdown. Multi-signal analysis — combining HRV, sleep, heart rate, respiratory rate, and training load data — provides the comprehensive picture needed to catch the transition between stages.
Can AI Detect Overtraining Better Than Traditional Monitoring Methods?
AI-powered analysis detects overtraining risk more reliably than traditional monitoring because it evaluates multiple signals simultaneously and identifies non-obvious patterns across time. Traditional methods rely on single-metric thresholds or subjective athlete questionnaires — both of which miss the nuanced, multi-system nature of the overtraining continuum7.
A coach checking a single morning HRV reading might see a normal value and prescribe a hard session. An AI system analyzing the same athlete sees that while today’s HRV is numerically normal, the 7-day trend is declining, sleep efficiency dropped from 92% to 84% over the past week, resting heart rate has crept up 4 bpm, and the ACWR just crossed 1.4. Individually, none of those signals trigger an alarm. Together, they paint a clear picture of an athlete drifting from functional overreaching toward non-functional territory.
The Meeusen et al. consensus statement specifically notes that no single reliable diagnostic marker for OTS exists — diagnosis requires the convergence of multiple indicators over time1. This is precisely the type of analysis AI excels at: pattern recognition across high-dimensional data streams where human cognition struggles to hold all the variables simultaneously.
SensAI approaches this by ingesting data from multiple wearable sources — Apple Watch, Garmin, Oura, Whoop — and using LLM-based reasoning rather than rigid threshold rules. Instead of “HRV below 40 = rest day,” the system contextualizes each metric within your personal baseline, recent training history, sleep patterns, and recovery trajectory. It reasons about your data the way an experienced sports scientist would — but with perfect memory and no blind spots.
How Do Wearables Track the Overtraining Continuum in Real Time?
Modern wearables collect the raw signals needed to monitor overtraining risk continuously, but most stop at surface-level metrics. The gap between data collection and actionable insight is where most athletes get lost.
An Apple Watch tracks heart rate every few seconds throughout the day, captures HRV during sleep, monitors respiratory rate, and logs workout intensity. Garmin devices add Training Status and Body Battery algorithms alongside VO2 max estimates and Training Load metrics. Oura provides detailed sleep staging, overnight HRV, body temperature deviations, and readiness scores. Whoop calculates strain, recovery percentage, and sleep performance8.
Each device captures valuable pieces of the puzzle, but none combines them into a unified overtraining risk assessment on its own. An Oura ring knows you slept poorly but does not know you ran 15% more volume than last week. A Garmin watch tracks your Training Load but does not factor in that your Oura detected a body temperature elevation suggesting early illness.
This is the integration problem that AI coaching platforms solve. By pulling data from your wearable ecosystem into a single analytical layer, tools like SensAI create a composite view of your position on the overreaching-to-OTS continuum. Your morning readiness assessment considers last night’s sleep from Oura, yesterday’s training strain from your watch, your HRV trend over the past two weeks, and how your current training block compares to your chronic load baseline — all before recommending whether today should be an intensity day, a volume day, or a recovery session.
How Should You Adjust Training When Biomarkers Signal Overreaching?
The moment your biomarker trends signal non-functional overreaching, the single most important intervention is reducing training load — and doing it immediately rather than “pushing through one more week.” Research consistently shows that early intervention shortens recovery time dramatically2.
If HRV has been suppressed for 3-5 consecutive days below your rolling 30-day baseline, reduce training intensity by 40-60% while maintaining some movement. Complete rest is typically unnecessary and may actually slow recovery compared to active recovery at low intensities4.
If your ACWR exceeds 1.5, do not add any new training volume. Maintain or reduce current load until the ratio drops back below 1.3. This typically takes 1-2 weeks of moderated training6.
If sleep metrics deteriorate alongside training markers — increased awakenings, reduced deep sleep, elevated overnight heart rate — prioritize sleep hygiene interventions alongside training reduction. Sleep disruption both results from and contributes to overreaching, creating a feedback loop that must be broken on both fronts3.
If symptoms persist beyond 2-3 weeks despite load reduction, consider consulting a sports medicine physician. Prolonged recovery suggests you may have crossed into OTS territory, which can involve hormonal, immunological, and neurological components that require professional evaluation1.
AI-powered coaching automates this decision tree. SensAI monitors your biomarker trends continuously and adjusts your daily programming in response — scaling intensity down at the first signs of accumulating fatigue and scaling back up as recovery markers improve. It catches the transition from productive overreaching to harmful overtraining at the point where intervention is most effective, rather than weeks later when damage is done.
Why Do Most Athletes Miss the Signs of Overtraining?
Most athletes miss the signs of overtraining because the early symptoms feel like normal hard training. Fatigue after a tough workout is expected. Slightly lower motivation is dismissed as a bad day. A performance dip is written off as needing to “push harder.”
The Kreher and Schwartz review highlights that the psychological symptoms of early NFO — increased irritability, decreased motivation, mood disturbances — often precede the physiological markers by days to weeks3. But athletes are culturally conditioned to train through discomfort. The same mental toughness that enables high performance also makes athletes the worst judges of when to stop.
Objective biomarker monitoring removes this bias entirely. Your wearable does not care about your ego or your upcoming race. It tracks what your body is actually doing. When HRV trends decline across a week while resting heart rate rises and sleep quality drops, the data tells a story that subjective feel cannot override.
The gap, historically, has been interpretation. Most athletes who own wearables check their morning readiness score, shrug, and train according to their plan anyway. What changes the equation is an AI layer that translates biomarker patterns into specific, actionable training modifications — automatically, without requiring the athlete to become their own sports scientist.
This is SensAI’s core value proposition for everyday athletes. Elite teams have full-time sports scientists monitoring load and recovery. Weekend warriors, age-group competitors, and recreational athletes have historically been on their own. An AI coach that ingests your wearable data and reasons about your overtraining risk brings that same level of monitoring to anyone with a smartwatch and a training goal.
What Does the Future of AI-Driven Overtraining Prevention Look Like?
The future of overtraining detection moves beyond reactive monitoring toward predictive intervention. Current systems catch overreaching as it happens. Next-generation AI will predict it before the first symptoms appear.
Emerging research explores combining wearable biomarkers with contextual data — work schedules, travel, nutrition, psychological stress — to build comprehensive load models that account for total life stress, not just training stress7. An AI system that knows you have a deadline at work, slept on a plane last night, and skipped two meals can predict elevated overtraining risk before any physiological marker changes.
Integration of continuous glucose monitoring with existing wearable data streams offers another frontier. Glycemic variability correlates with recovery status and may serve as an early biomarker for metabolic disruption associated with NFO and OTS7.
For now, the technology that exists today — multi-stream wearable data combined with intelligent AI analysis — already represents a massive leap from where most athletes were five years ago. The overtraining continuum is no longer a mysterious black box. It’s a trackable, quantifiable progression with clear biomarker signatures at each stage. The athletes who leverage that data intelligently — whether through their own analysis or through AI-powered platforms like SensAI — will train harder, recover smarter, and avoid the performance collapses that derail months of progress.
Footnotes
-
Meeusen, R., Duclos, M., Foster, C., Fry, A., Gleeson, M., Nieman, D., Raglin, J., Rietjens, G., Steinacker, J., & Urhausen, A. “Prevention, Diagnosis, and Treatment of the Overtraining Syndrome: Joint Consensus Statement of the European College of Sport Science and the American College of Sports Medicine.” Medicine & Science in Sports & Exercise, 45(1), 186-205, 2013. https://doi.org/10.1249/MSS.0b013e318279a10a ↩ ↩2 ↩3 ↩4 ↩5 ↩6 ↩7
-
Halson, S. L., & Jeukendrup, A. E. “Does Overtraining Exist? An Analysis of Overreaching and Overtraining Research.” Sports Medicine, 34(14), 967-981, 2004. https://doi.org/10.2165/00007256-200434140-00003 ↩ ↩2 ↩3 ↩4 ↩5
-
Kreher, J. B., & Schwartz, J. B. “Overtraining Syndrome: A Practical Guide.” Sports Health, 4(2), 128-138, 2012. https://doi.org/10.1177/1941738111434406 ↩ ↩2 ↩3 ↩4 ↩5 ↩6
-
Plews, D. J., Laursen, P. B., Stanley, J., Kilding, A. E., & Buchheit, M. “Training Adaptation and Heart Rate Variability in Elite Endurance Athletes: Opening the Door to Effective Monitoring.” Sports Medicine, 43(9), 773-781, 2013. https://doi.org/10.1007/s40279-013-0071-8 ↩ ↩2 ↩3
-
Buchheit, M. “Monitoring Training Status with HR Measures: Do All Roads Lead to Rome?” Frontiers in Physiology, 5, 73, 2014. https://doi.org/10.3389/fphys.2014.00073 ↩ ↩2
-
Gabbett, T. J. “The Training—Injury Prevention Paradox: Should Athletes Be Training Smarter and Harder?” British Journal of Sports Medicine, 50(5), 273-280, 2016. https://doi.org/10.1136/bjsports-2015-095788 ↩ ↩2 ↩3 ↩4
-
Kellmann, M., Bertollo, M., Bosquet, L., Brink, M., Coutts, A. J., Duffield, R., Erlacher, D., Halson, S. L., Hecksteden, A., Heidari, J., Kallus, K. W., Meeusen, R., Mujika, I., Robazza, C., Skorski, S., Venter, R., & Beckmann, J. “Recovery and Performance in Sport: Consensus Statement.” International Journal of Sports Physiology and Performance, 13(2), 240-245, 2018. https://doi.org/10.1123/ijspp.2017-0759 ↩ ↩2 ↩3
-
SensAI. “Fitness Apps Integrated with Oura and Whoop for HRV Control.” SensAI Blog, 2026. https://www.sensai.fit/blog/fitness-apps-hrv-oura-whoop-integration ↩
Related Articles

How Strong Should You Be? Strength Standards by Age, Bodyweight & Sex
15 min read
Magnesium for Sleep and Recovery: What the Research Says About Forms, Doses, and HRV Impact (2026)
14 min read

Cardiac Drift and Aerobic Decoupling: What Your Heart Rate Tells You About Aerobic Fitness (2026 Research Guide)
13 min read