Do Muscle Imbalances Cause Injury? What the Research Actually Says About Asymmetry
Ask an AI if your left-right strength difference is 'dangerous' and it repeats a 10% rule that was never validated for that purpose. Here's what the prospective evidence really shows about asymmetry and injury risk — and how to test yourself honestly at home.
SensAI Team
12 min read
Get a training plan that adapts to your recovery — free on iOS
Type “is a 10% strength difference between my legs bad?” into any AI chatbot and you’ll get a confident, tidy, wrong answer.
It will tell you that under 10% is safe, over 10% is dangerous, and you should train to close the gap. That number sounds precise. It sounds like it came from a lab.
It didn’t come from a lab that ever tested it as an injury threshold. It’s a borrowed rule of thumb from post-surgery rehab, retrofitted onto healthy bodies where it was never meant to live.
So let’s do the thing the chatbot won’t: look at what the actual prospective research says about asymmetry and injury, where the real risk lives, and how you can screen yourself at home without spiraling over a number that most healthy athletes have anyway.
The Honest Answer: Does Asymmetry Actually Cause Injury?
Asymmetry by itself is a weak and inconsistent predictor of injury. Small side-to-side differences are everywhere in healthy, uninjured athletes — they are the norm, not a red flag.
Here’s the nuance the “10% rule” flattens. When researchers pooled 28 prospective cohort studies tracking asymmetry and later injury, the association was so inconsistent that they couldn’t issue a clean verdict either way.1 Some studies found a link. Many didn’t. The picture is noise, not a clean line in the sand.
Where risk does seem to climb is at the extremes — large asymmetries (roughly north of 10-15% on lower-limb strength or hop tasks in some cohorts) stacked on top of other problems like poor movement quality or a genuine range-of-motion restriction.2 Raw asymmetry alone, in an otherwise healthy mover, is a much weaker signal than the internet believes.
Think of it like blood pressure. A single slightly-high reading in isolation means little. The same number, paired with other risk factors and a trend over time, means something. Asymmetry works the same way — context is everything.
| Side-to-side difference | What it usually means | What to do |
|---|---|---|
| 0-10% (green) | Normal. Present in nearly all healthy athletes. | Nothing. Keep training. This is not a problem to “fix.” |
| 10-15% (yellow) | Worth watching, especially with a ROM restriction or a movement that feels off. | Add unilateral work; retest in 6-8 weeks. Don’t panic. |
| >15% + a restriction, pain, or prior injury (red) | The combination — not the number alone — is where risk concentrates. | Address the specific limb/pattern; if pain is present, see a clinician. |
The takeaway: the danger was never “your legs aren’t identical.” It’s a large gap plus something else going wrong. Chasing perfect symmetry is aiming at the wrong target.
What “Asymmetry” Even Means (and Why Some Is Supposed to Be There)
Not all asymmetry is created equal, and some of it is a feature, not a bug.
Exercise physiologist Andy Galpin, a professor at Parker University, frames asymmetry through three separate lenses: morphology (is one side physically bigger?), tissue quality (is one side stiffer or more restricted?), and function (does one side produce force or move differently?). A difference in one lens doesn’t automatically mean a problem in another. A bodybuilder can have a visibly larger dominant arm with no functional deficit at all.
Now consider what your sport has been doing to you for years. A pitcher’s throwing shoulder, a fencer’s lead leg, a tennis player’s dominant forearm — these adapt asymmetrically because the sport demands it. That asymmetry is the body optimizing for the task, not breaking down.
There’s an even deeper layer. Two limbs working together produce less total force than the sum of each limb working alone — a well-documented quirk called the bilateral force deficit.3 Your nervous system isn’t “wasting” force; this is normal physiology. It’s one more reason a single symmetry snapshot can mislead you.
Chris Bishop, an associate professor at the London Sport Institute who has published some of the most-cited work on the topic, makes the point that asymmetry is task-dependent — you can look imbalanced on a jump test and symmetrical on a strength test on the same day.4 Which means the “number” depends heavily on how you measured it.
This is exactly where individualization matters more than a universal threshold. A coach that actually knows your history treats a thrower’s dominant-side adaptation differently than a novice’s compensation pattern. An AI coach like SensAI that carries your training background can hold that distinction — a logged sport, a prior injury — instead of flagging every difference as a defect. Context turns a scary number into a meaningful one.
The goal was never symmetry for symmetry’s sake. It’s function.
The Strength-Asymmetry-and-Injury Evidence, Study by Study
The prospective evidence points to a soft dose-response tendency buried in a lot of individual noise — not a clean threshold.
Start with the big picture. The systematic review of 28 prospective cohort studies on lower-limb asymmetry and injury found the results “highly inconsistent,” with a clear statement on the association being difficult to make because studies varied wildly in how they defined injury and calculated asymmetry.1 That inconsistency is itself the finding.
Some individual cohorts do detect a signal at the extremes. Bishop and colleagues have reported that larger asymmetries — often above roughly 10-15% on jump and hop tasks — track with elevated injury risk in specific athlete groups, while emphasizing that asymmetry must be analyzed on an individual, not group-average, basis.4
The single strongest thread runs through the hamstrings. Adding the Nordic hamstring exercise — a targeted eccentric movement — to a training program cut hamstring injury rates roughly in half in a randomized controlled trial of amateur soccer players.5 A later meta-analysis of over 8,000 athletes found a similar effect: including the Nordic exercise reduced hamstring injuries by about 51%.6
But here’s the twist that keeps everyone honest. When researchers led by Nicol van Dyk pooled the data on whether baseline strength testing actually predicts who gets hurt, the association between eccentric hamstring strength and future injury was weak.7 The exercise works. Using a strength number as a screen to find the person who will get injured — that’s the part that doesn’t hold up.
And a crucial caveat wraps around all of it: asymmetry often follows a prior injury rather than causing the next one. When you strain a hamstring, that side detrains. The asymmetry you measure afterward is a scar, not necessarily a cause. Association isn’t causation, and the arrow frequently points backward.
If you want a deeper practical walkthrough of building hamstring resilience, our hamstring strengthening guide covers the Nordic curl and its progressions in detail.
Why the “10% Rule” and LSI Overestimate Recovery
The famous 90% symmetry benchmark comes from ACL rehab, and even there it flatters the numbers.
Here’s how it works. The Limb Symmetry Index (LSI) is calculated as the injured limb divided by the uninjured limb, times 100. Hit 90% and you’re “cleared.” Simple. Except the reference limb is the problem.
Lynn Snyder-Mackler, an Alumni Distinguished Professor of Physical Therapy at the University of Delaware, and colleagues showed why. After ACL surgery, the uninjured leg also detrains — the athlete stops training hard, and the healthy limb weakens too.8 So when you divide the injured limb by a deflated reference, the ratio looks better than reality.
Picture grading yourself against a class that all failed. Scoring “90% of the class average” sounds great until you realize the whole class bombed the exam. Their research found athletes hitting a reassuring 90% LSI while both limbs sat below the athlete’s own pre-injury baseline.8
The fix wasn’t to abandon symmetry — it was to raise the bar. In the Delaware-Oslo ACL cohort, athletes who passed a rigorous return-to-sport battery (strength symmetry plus hop tests plus time) before returning had 84% fewer reinjuries than those who returned without meeting the criteria.9 The same work found each month of delayed return, up to nine months, cut reinjury risk further.
So symmetry testing isn’t useless — it’s powerful in the right context, against the right reference. A symmetry number is only as good as the thing you’re comparing to.
Why Single Movement Screens Don’t Predict Injury Well
A one-time movement screen is a decent conversation starter and a poor crystal ball.
Take the Functional Movement Screen (FMS), a seven-part battery scored out of 21 that promised to flag injury-prone athletes with a single composite number. It’s widely used. It’s intuitive. And as an injury predictor, it largely doesn’t work.
Robert Moran and colleagues pooled the prospective evidence in a meta-analysis and concluded that the strength of association between FMS composite scores and later injury “does not support its use as an injury prediction tool.”10 The popular cutoff of 14-or-below produced too many false alarms and missed too many people who got hurt anyway.
This is the same lesson the LSI teaches, in a different costume. A single test, on a single day, screening a complex outcome, will misclassify a lot of people. Injury is multifactorial — training load, sleep, prior injury, fatigue, plain bad luck — and no seven-minute screen captures that.
That doesn’t make screens worthless. Use them to establish a baseline, to open a conversation, to track yourself over time. Just don’t treat a score as a binary verdict on your future.
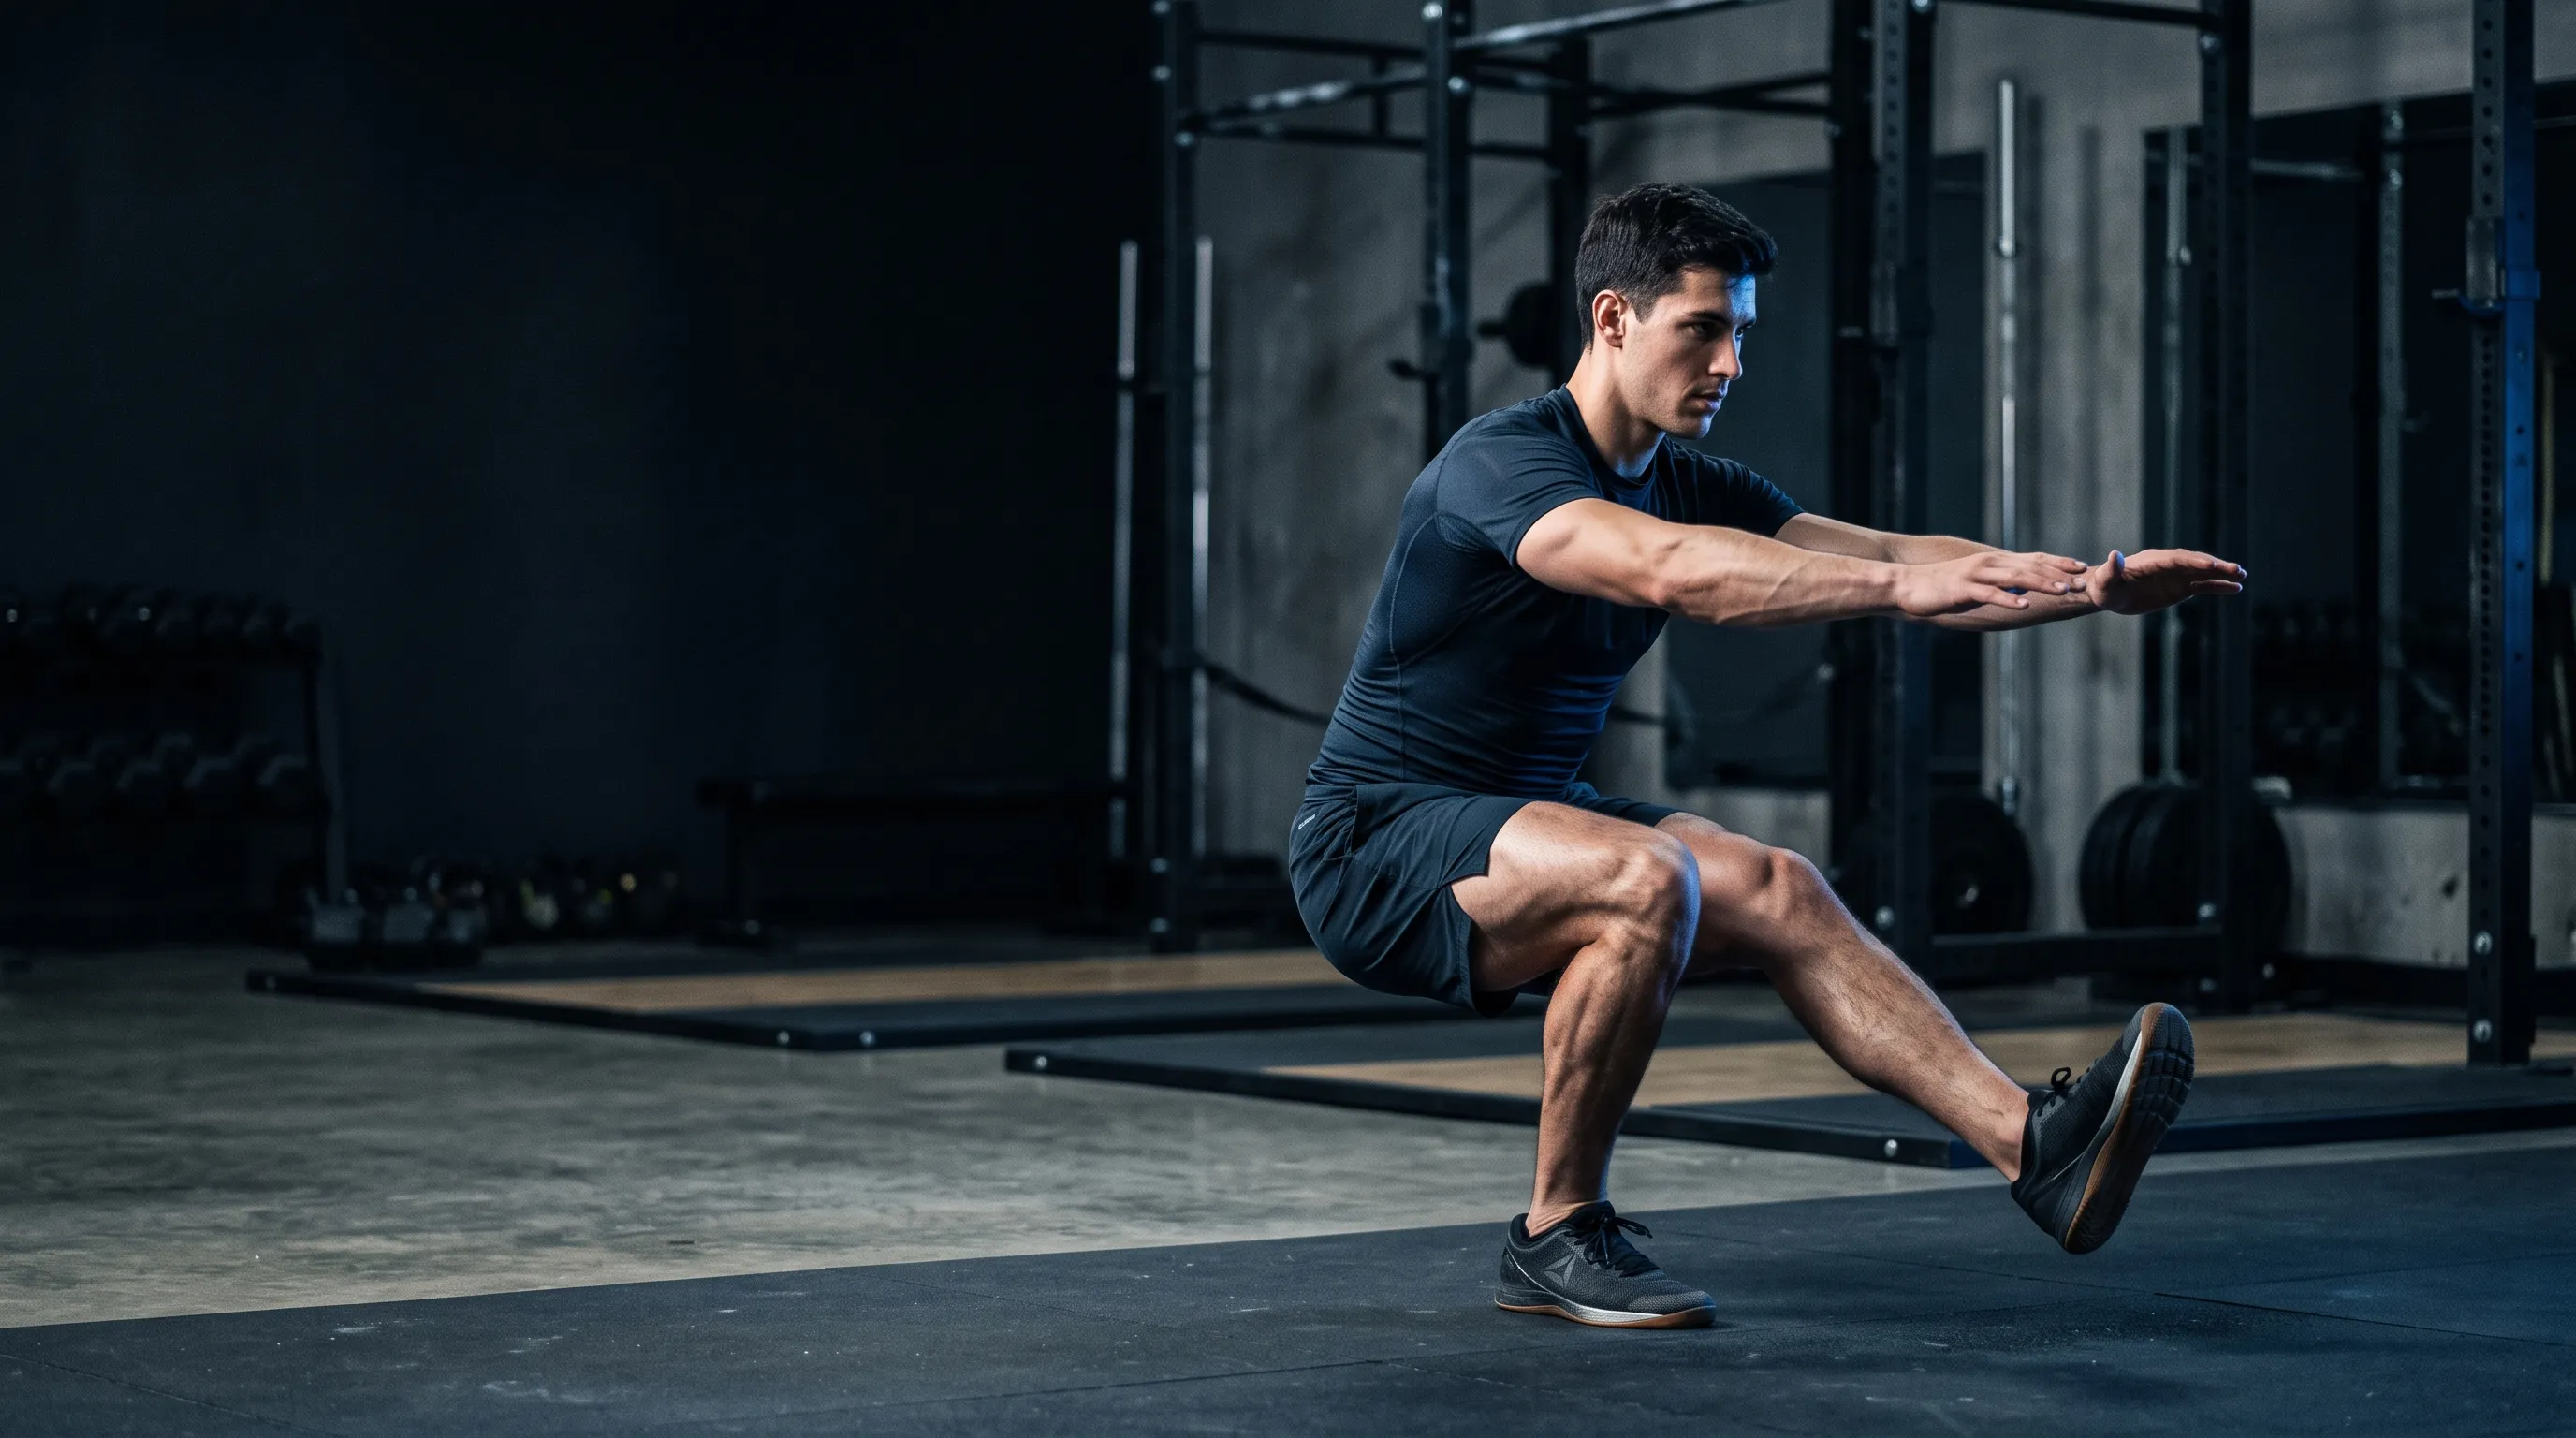
How to Test Yourself at Home (With Honest Caveats)
You can gather useful side-to-side signal at home in fifteen minutes — as long as you treat it as a rough snapshot, not a diagnosis.
Run these on both sides and note the difference. None of them are medical assessments.
Strength and power (do both sides, compare):
- Single-leg sit-to-stand. From a chair, count how many controlled reps you can do on each leg. In healthy people, sides are usually within about 10% of each other.
- Single-leg hop for distance. Hop as far as you can on one leg, land under control, measure. Repeat on the other side. Compute the difference as a rough symmetry percentage. In uninjured recreational athletes, essentially everyone lands within 10% side to side.11
- Single-leg calf raise. Count clean reps to fatigue on each side.
Range of motion (flag an asymmetric restriction, not absolute tightness):
- Knee-to-wall (ankle dorsiflexion). Kneel facing a wall, push the knee forward over the toes without lifting the heel, measure the distance from wall to big toe. A side-to-side gap here matters more than any single “ideal” number.
- Hip rotation and overhead reach, again comparing left to right.
The push:pull audit. Tally your weekly pressing volume against your pulling volume. A big skew toward pressing is common and often pairs with rounded-shoulder posture — though it’s worth saying plainly that “bad posture causes pain” is overstated in the research; posture and pain are only loosely linked.
Interpretation: under ~10% difference is green and normal. Around 10-15% is yellow — worth a note and a retest. A larger gap, especially paired with a ROM restriction or nagging discomfort, is the yellow-to-red zone where targeted work makes sense.
One honest limitation: any single test day is noisy. You slept badly, you’re under-caffeinated, you measured sloppily. The signal lives in the trend, not the snapshot. This is where logging beats guessing — tools like SensAI that record your side-to-side numbers and ROM over time turn a one-off data point into a line you can actually read, and its memory can surface when an asymmetry lines up with a logged injury or a pain report you mentioned weeks ago.
If you want an objective, well-validated single number to track alongside these, grip strength is one of the most reliable at-home benchmarks there is.
And the non-negotiable caveat: these are screening prompts, not a clinical exam. Persistent pain, swelling, or a difference that keeps growing means it’s time to see a physical therapist or physician.
Fixing Imbalances: Unilateral Training and Targeted Mobility
If you’ve found a real, large asymmetry, the fix is specific unilateral work plus targeted mobility for the side that’s actually restricted — not blanket stretching and not endless corrective drills.
Unilateral training is the primary lever. Single-leg and single-arm work forces each side to do its own job, so the strong side can’t quietly cover for the weak one. A neat rule: start the weaker side first, and cap the stronger side at whatever the weaker side managed. Do 8 reps on the weak leg, do only 8 on the strong one. Over time the gap narrows.
Reassuringly, you don’t sacrifice performance to train this way — a controlled trial found unilateral squat training matched bilateral training for building strength, sprint speed, and change-of-direction in athletes.12 Split squats and single-leg work aren’t a downgrade; they’re a targeting tool.
For mobility, aim the work. If your knee-to-wall test showed the left ankle five centimeters shorter than the right, that left ankle is the target — not a generic full-body stretching routine. Both stretching and loaded end-range work reliably improve range of motion,13 so spend that time where the restriction actually is. Our hip mobility routine is a good template for making mobility specific rather than scattershot.
For a push-heavy imbalance, rebalance the ledger: add pulling volume and horizontal rows, and stop assuming a posture tweak will fix a pain problem. Our guide to fixing rounded shoulders leans on the same principle — load the pattern you’re missing. And if the imbalance shows up as a rotational or anti-rotation weakness through the trunk, anti-rotation core training trains exactly that.
The best-evidenced targeted intervention remains the eccentric route for the hamstrings — the Nordic hamstring exercise, which halved injury rates in the trials above.56 If there’s one “corrective” worth doing on faith, it’s that one.
Here’s the mindset shift: reassess, don’t obsess. Retest in six to eight weeks. And accept that some asymmetry — the throwing shoulder, the dominant leg — is permanent, adaptive, and completely fine. The goal is closing problematic gaps, not manufacturing a mirror-image body.
Correcting a real imbalance is a per-person prescription — this specific limb, this specific restriction, this specific volume cap — which is precisely the kind of from-scratch programming an LLM-based coach like SensAI generates, rather than handing everyone the same symmetrical template.
The Bottom Line
Muscle imbalances, on their own, are a weak and overhyped injury predictor. Small side-to-side differences are normal, often adaptive, and present in nearly every healthy athlete. The “under 10% safe, over 10% dangerous” rule was borrowed from ACL rehab and never validated as a general injury threshold.
Real risk concentrates at the extremes — large asymmetries stacked on top of movement problems, range-of-motion restrictions, or a prior injury. And the single most useful thing to remember is that asymmetry often follows an injury rather than causing the next one.
So screen yourself, sure. Track the trend, not the snapshot. Add unilateral work and targeted mobility where a genuine gap shows up. Do your Nordic curls. Then stop staring at the number.
Because imbalances are deeply individual — they depend on your sport, your history, your specific restrictions — and they change over time. The fix isn’t a symmetry checklist. It’s programming that remembers your asymmetries, your logged injuries, and your ROM limits, and prescribes the matching unilateral and mobility work. That kind of memory — carrying your context from one week to the next — is the whole point of building SensAI as an AI coach instead of a spreadsheet.
References
Footnotes
-
Guan Y, Bredin SSD, Taunton J, Jiang Q, Wu N, Warburton DER. “Association between Inter-Limb Asymmetries in Lower-Limb Functional Performance and Sport Injury: A Systematic Review of Prospective Cohort Studies.” Journal of Clinical Medicine, 2022;11(2):360. https://www.ncbi.nlm.nih.gov/pmc/articles/PMC8779786/ ↩ ↩2
-
Helme M, Tee J, Emmonds S, Low C. “Does lower-limb asymmetry increase injury risk in sport? A systematic review.” Physical Therapy in Sport, 2021;49:204-213. https://www.sciencedirect.com/science/article/abs/pii/S1466853X21000468 ↩
-
Škarabot J, Cronin N, Strojnik V, Avela J. “Bilateral deficit in maximal force production.” European Journal of Applied Physiology, 2016;116(11-12):2057-2084. https://pubmed.ncbi.nlm.nih.gov/27582260/ ↩
-
Bishop C, Turner A, Read P. “Effects of inter-limb asymmetries on physical and sports performance: a systematic review.” Journal of Sports Sciences, 2018;36(10):1135-1144. https://pubmed.ncbi.nlm.nih.gov/28767317/ ↩ ↩2
-
van der Horst N, Smits DW, Petersen J, Goedhart EA, Backx FJG. “The Preventive Effect of the Nordic Hamstring Exercise on Hamstring Injuries in Amateur Soccer Players: A Randomized Controlled Trial.” American Journal of Sports Medicine, 2015;43(6):1316-1323. https://journals.sagepub.com/doi/10.1177/0363546515574057 ↩ ↩2
-
Al Attar WSA, Soomro N, Sinclair PJ, Pappas E, Sanders RH. “Effect of Injury Prevention Programs that Include the Nordic Hamstring Exercise on Hamstring Injury Rates in Soccer Players: A Systematic Review and Meta-Analysis.” Sports Medicine, 2017;47(5):907-916. https://link.springer.com/article/10.1007/s40279-016-0638-2 ↩ ↩2
-
van Dyk N, Behan FP, Whiteley R. “Including the Nordic hamstring exercise in injury prevention programmes halves the rate of hamstring injuries: a systematic review and meta-analysis of 8459 athletes.” British Journal of Sports Medicine, 2019;53(21):1362-1370. https://pubmed.ncbi.nlm.nih.gov/30808663/ ↩
-
Wellsandt E, Failla MJ, Snyder-Mackler L. “Limb Symmetry Indexes Can Overestimate Knee Function After Anterior Cruciate Ligament Injury.” Journal of Orthopaedic & Sports Physical Therapy, 2017;47(5):334-338. https://www.jospt.org/doi/10.2519/jospt.2017.7285 ↩ ↩2
-
Grindem H, Snyder-Mackler L, Moksnes H, Engebretsen L, Risberg MA. “Simple decision rules can reduce reinjury risk by 84% after ACL reconstruction: the Delaware-Oslo ACL cohort study.” British Journal of Sports Medicine, 2016;50(13):804-808. https://pubmed.ncbi.nlm.nih.gov/27162233/ ↩
-
Moran RW, Schneiders AG, Mason J, Sullivan SJ. “Do Functional Movement Screen (FMS) composite scores predict subsequent injury? A systematic review with meta-analysis.” British Journal of Sports Medicine, 2017;51(23):1661-1669. https://pubmed.ncbi.nlm.nih.gov/28360142/ ↩
-
Munro AG, Herrington LC. “Between-session reliability of four hop tests and the agility T-test.” Journal of Strength and Conditioning Research, 2011;25(5):1470-1477. https://pubmed.ncbi.nlm.nih.gov/21116200/ ↩
-
Speirs DE, Bennett MA, Finn CV, Turner AP. “Unilateral vs. Bilateral Squat Training for Strength, Sprints, and Agility in Academy Rugby Players.” Journal of Strength and Conditioning Research, 2016;30(2):386-392. https://pubmed.ncbi.nlm.nih.gov/26200193/ ↩
-
Konrad A, Nakamura M, Tilp M, Donti O, Behm DG. “Foam Rolling Training Effects on Range of Motion: A Systematic Review and Meta-Analysis.” Sports Medicine, 2022;52(10):2523-2535. https://pubmed.ncbi.nlm.nih.gov/35616852/ ↩