Heat Acclimation by City: A Wearable-Guided 14-Day Dew Point + HR Drift Protocol for Safer Summer Performance
City-specific, wearable-guided 14-day heat acclimation using dew point, HeatRisk, HR drift, and HRV to adjust pace safely for summer running.

SensAI Team
12 min read
Get a training plan that adapts to your recovery — free on iOS

Heat Acclimation by City: A Wearable-Guided 14-Day Dew Point + HR Drift Protocol for Safer Summer Performance
Short answer: if you train through summer heat, the safest performance strategy is to combine city forecast stress (dew point + HeatRisk + overnight lows) with your wearable response (HR drift, HRV, resting HR, sleep), then progress load over 14 days, not by feel alone.123
Heat adaptation often starts quickly, but full confidence in race-specific sessions usually needs two weeks. Korey Stringer Institute summarizes the practical window clearly: acclimation commonly develops over 7-14 days.1 This guide uses that window to organize decisions you make for the place where you actually live and train.
Why dew point beats relative humidity for run-day decisions
Relative humidity tells you how full the air is relative to its current temperature. Dew point tells you how much moisture is actually in the air. For runners, dew point is usually the better “how hard will cooling be?” signal.4
That matters because your cooling system depends on sweat evaporation. When dew point is high, evaporation falls, skin stays wetter, and cardiovascular strain rises faster at the same pace.3
For race outcomes, weather strain is not a small effect. Matthew R. Ely and colleagues put it directly: “There is a progressive slowing of marathon performance as the WBGT increases from 5 to 25 degrees C.”5
In other words: if you only check relative humidity, you can underestimate stress. This protocol therefore treats dew point as a first-pass pacing modifier before you even look at splits.
Dew point comfort bands (<=55°F, 55-65°F, >=65°F) + heat-index context
Use this simple banding system from NWS guidance:4
- <=55°F dew point: generally comfortable
- 55-65°F dew point: sticky; cooling starts to degrade
- >=65°F dew point: oppressive for sustained quality work
Then add heat index context. NWS notes heat index values are calculated for shade and can be up to 15°F higher in direct sun.6 So a runnable forecast at sunrise can become a risky one in exposed routes two hours later.
Practical coaching implications:
- <=55°F DP: normal pace targets often possible if other metrics are stable.
- 55-65°F DP: adjust by effort/HR, trim quality volume.
- >=65°F DP: prioritize duration control, pace caps, and earlier start windows.
City-first heat risk workflow (HeatRisk + overnight lows + session timing)
Dew point is your micro check. HeatRisk is your macro check.
HeatRisk is a 0-4 scale (little/none to extreme) that blends daytime highs, overnight lows, and cumulative heat burden.78 That overnight component is crucial for athletes: poor nighttime cooling reduces recovery and can stack strain across days.
Rick Spinrad (NOAA Administrator) framed why this matters operationally: “Climate change is causing more frequent and intense heat waves… resulting in nearly 1,220 deaths each year in the U.S. alone.”8
For training planning, use three forecast anchors each evening:
- Next-day hourly dew point (local window stress)
- HeatRisk category (cumulative public-health risk)
- Overnight low (recovery opportunity)
If two of three worsen, downgrade the next day’s load before the alarm goes off.
How to pick the safest time-of-day training window by ZIP code
Use this ZIP-level routine the night before:
- Open local hourly forecast and note dew point by hour.4
- Check regional HeatRisk for your county/zone.7
- Compare sunrise window vs midday window for:
- dew point delta
- heat index delta
- sunlight exposure (route shade)
- Pick the lowest combined stress window that still fits your session objective.
Quick decision rule:
- HeatRisk 0-1 + DP <=55°F: most session types feasible.
- HeatRisk 2 + DP 55-65°F: keep quality but reduce density/volume.
- HeatRisk 3-4 or DP >=65°F: move quality indoors or postpone hard work.
Use these inputs at the calendar level so your hardest sessions land in your safest local windows, not just on fixed weekday templates.
7 vs 14 days of heat acclimation—what changes and when
A 7-day block often builds early tolerance. A 14-day block usually builds race-useful stability.139
The international heat consensus reports that near-complete cardiovascular and sudomotor adaptations often need 6-10 days, while about 2 weeks can better optimize aerobic performance in heat.3 In one protocol cited in that consensus, exercise capacity in severe heat improved from 48 to 80 minutes after 9-12 days of daily heat training.3
Andreas D. Flouris and colleagues summarize the physiological direction of travel: “Heat acclimation is accompanied by reduced core temperature, significant bradycardia, and marked alterations in HRV…”10
Days 1-4 ramp, Days 5-10 near-complete cardiovascular/sudomotor adaptation, Days 11-14 consolidation
Use this practical ladder:
| Phase | Goal | Session guidance | Progress check |
|---|---|---|---|
| Days 1-4 (Ramp) | Introduce heat stress safely | Keep intensity mostly easy-moderate; reduce total load; prioritize hydration | HR drift and RPE stay controlled |
| Days 5-10 (Primary adaptation) | Build tolerance and restore quality touches | Reintroduce controlled tempo/threshold in lower-risk time windows | Smaller HR drift at same pace; better post-run recovery |
| Days 11-14 (Consolidation) | Stabilize race-specific execution | Keep one key workout + one long session with strict heat modifiers | Consistent recovery metrics after hard days |
Why not rush? CDC/NIOSH acclimatization guidance for high-heat exposure uses conservative load progression (e.g., starting around 20% exposure then increasing by 20% per day for new workers), reinforcing that progressive heat dosing is safer than abrupt full-load exposure.2
For endurance athletes, this protocol adapts that principle into training load rather than occupational exposure minutes.
Wearable decision rules in hot weather
Environment tells you potential stress. Wearables tell you your realized stress.
The protocol’s base stack:
- During run: HR drift + decoupling between HR and pace/power
- Next morning: HRV + resting HR + sleep continuity
- Weekly: whether high-heat sessions are trending more tolerable or less
This keeps the decisions data-driven and practical, matching SensAI’s no-hype coaching style.
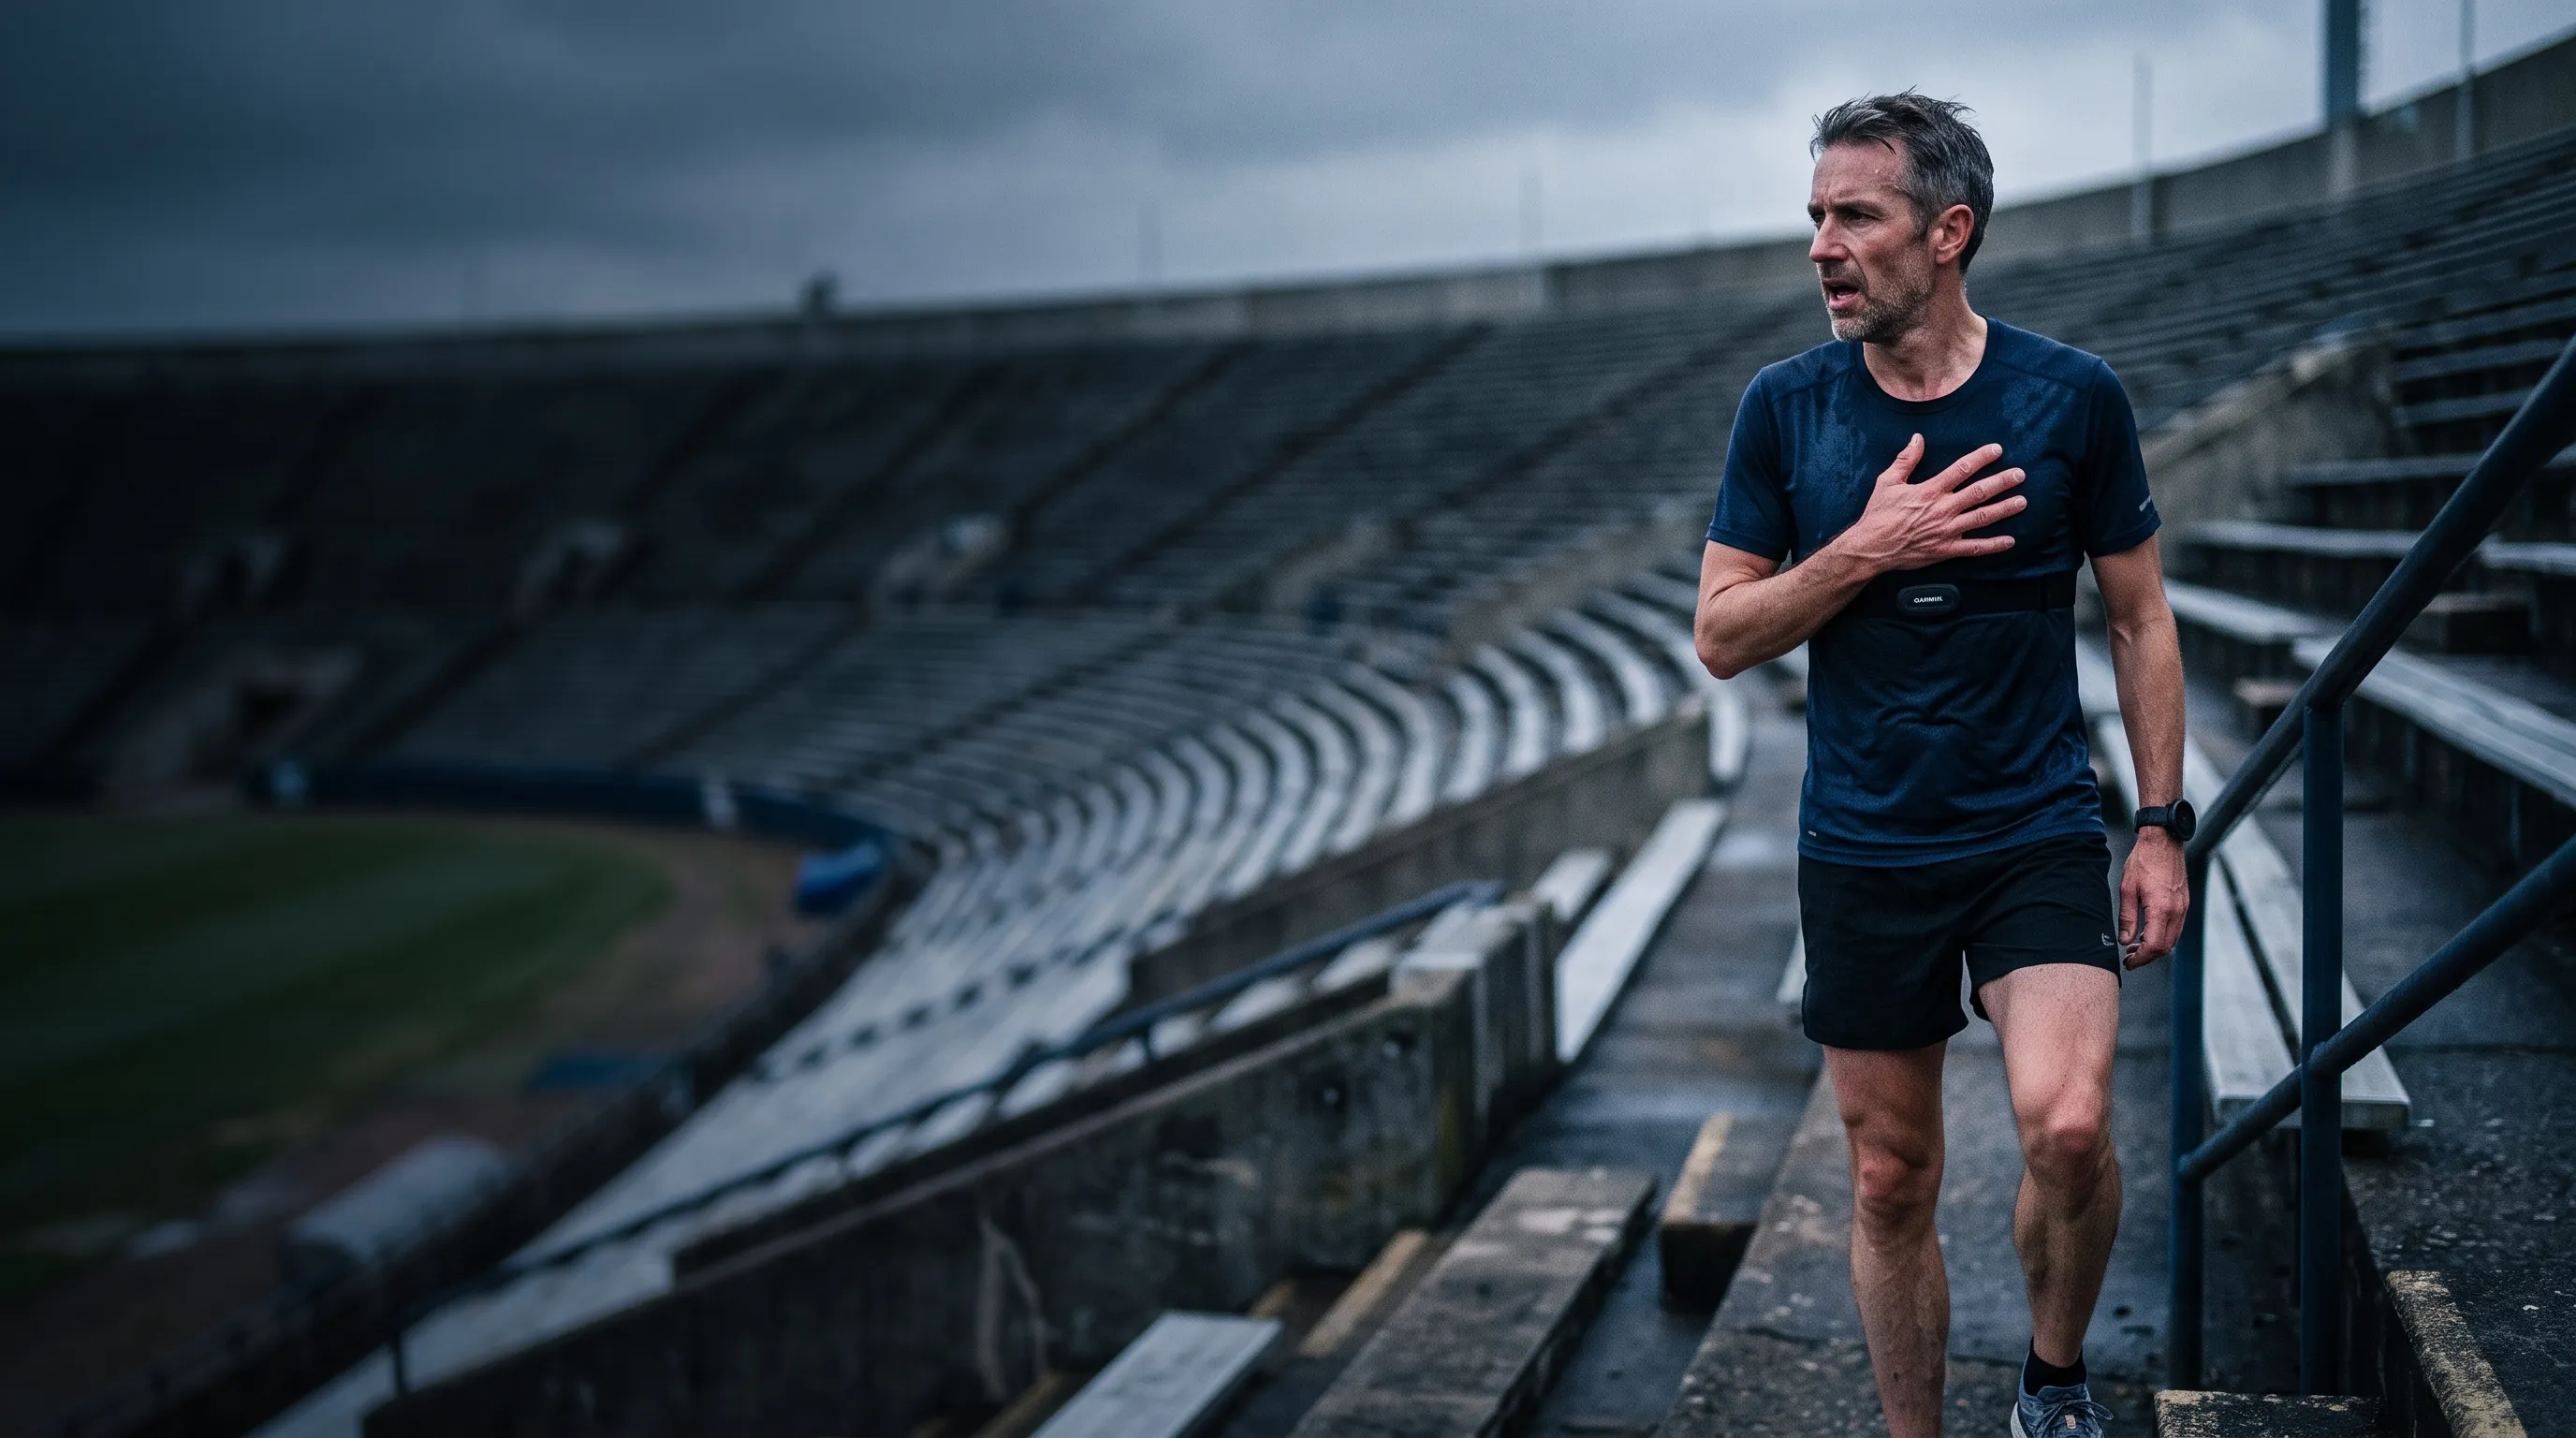
Interpreting HR drift under heat stress during steady runs
In heat, some drift is expected. Excess drift is a warning.
Use this field rule on steady aerobic runs of 30-60+ minutes:
- Mild drift: expected heat cost; session likely acceptable.
- Moderate drift: reduce pace and/or duration today.
- Large drift early: downgrade to easy effort or end session.
Pair this with conditions:
- If dew point and HeatRisk are elevated, tighten your acceptable drift range.
- If overnight recovery was poor, treat the same drift as higher risk.
Race performance data supports taking these cues seriously. Ely et al. showed progressive slowdown with rising WBGT, including top male slowdown vs course record of 1.7%, 2.5%, 3.3%, and 4.5% across WBGT quartiles.5
Vihma et al. found best endurance performance likelihood around 7.5-15°C WBGT (about 10-17.5°C air temperature), and each 1°C WBGT outside optimum was linked to about 0.3-0.4% performance reduction.11
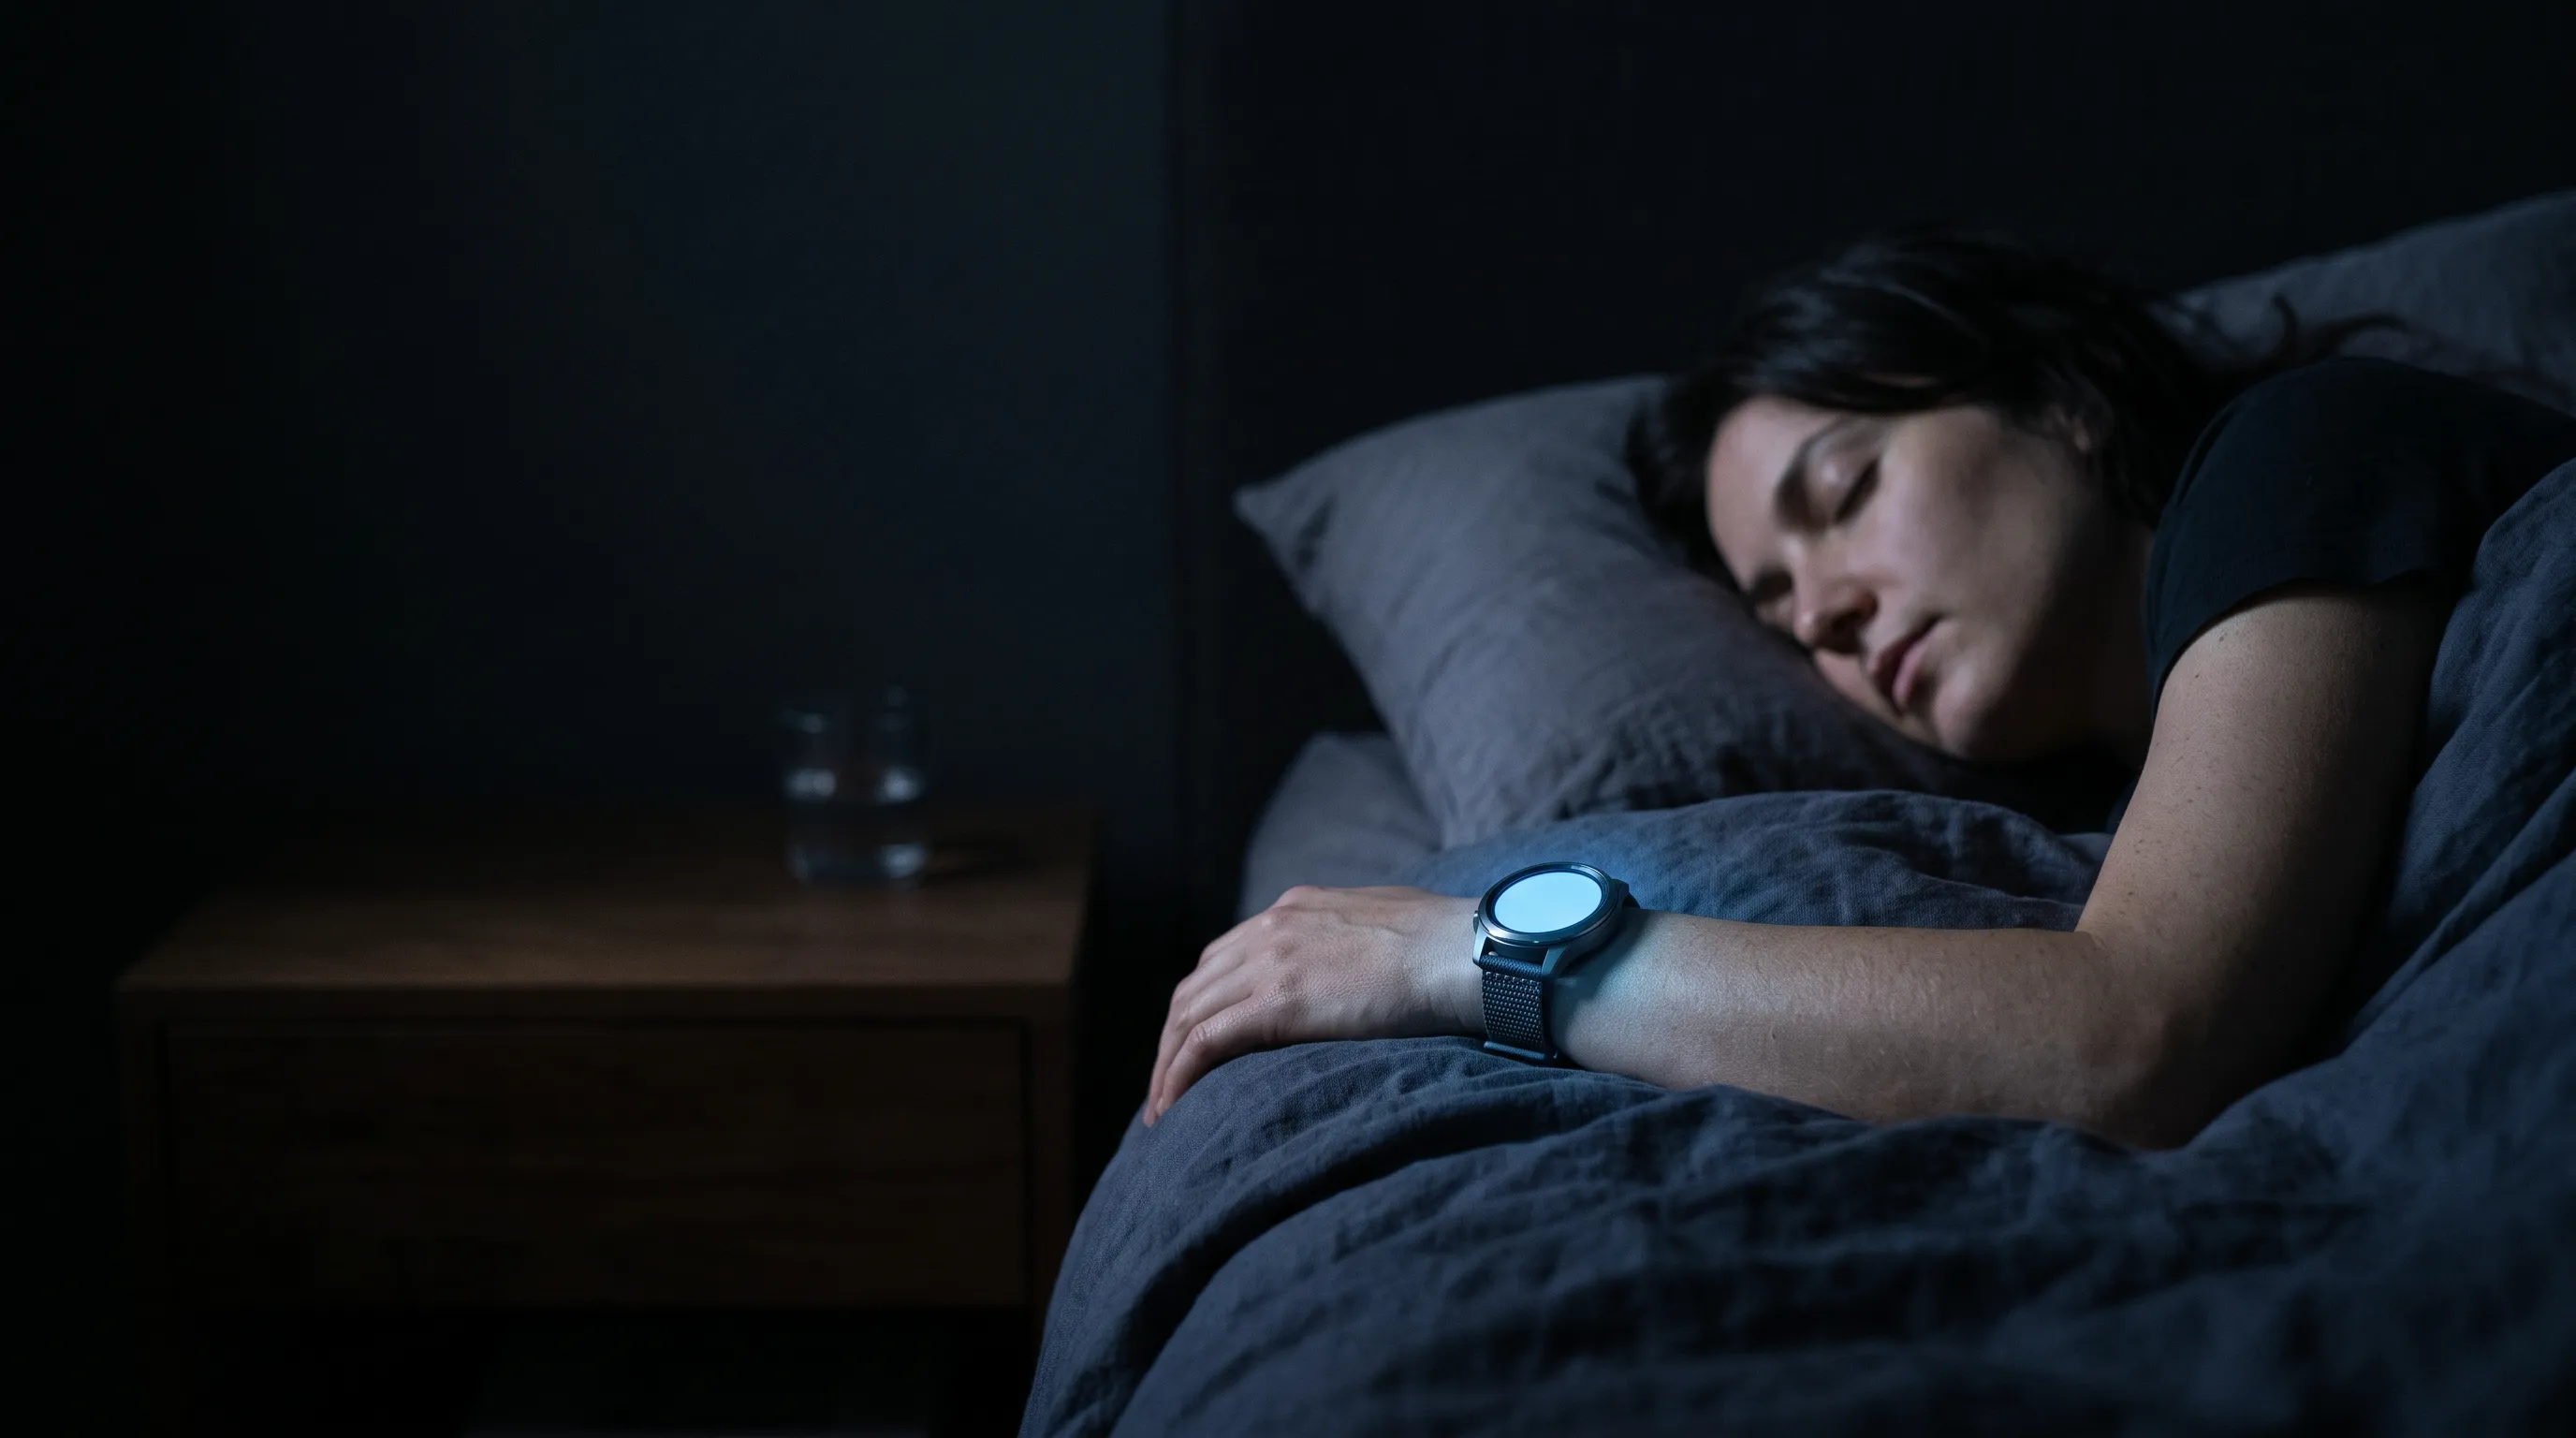
Using HRV, RHR, sleep, and temperature trends to modify daily load
Morning readiness in summer should be trend-based, not single-score based.
Modify triggers in hot blocks:
- HRV below normal trend + elevated resting HR
- sleep disruption after hot evening sessions
- repeated high HR drift at unchanged easy pace
- elevated skin/body temperature trend (if available on device)
Keep one additional guardrail: dehydration. Heat consensus recommendations repeatedly associate >2% body-mass loss with impaired aerobic performance in warm-hot conditions.3
Device implementation notes:
- Garmin: heat acclimation adjustments are triggered when training temperature exceeds 22°C (72°F).12
- WHOOP: use strain/recovery framework to avoid stacking high strain on poor recovery days.13
- Oura: use readiness trend across nights, not one morning value.14
- Apple Watch and others: apply the same trend-first logic with your available HR, sleep, and resting HR metrics.
Geo-adaptive train/modify/postpone ladder
This is the practical core: combine forecast stress + wearable response into one action.
Train
Use when:
- HeatRisk low (0-1), dew point manageable
- overnight recovery acceptable
- HR drift in expected range
Action: train as planned with heat pacing modifiers.
Modify
Use when one risk cluster appears:
- HeatRisk 2 or dew point 55-65°F
- mild HRV/RHR warning trend
- moderate HR drift in first half of session
Action: reduce intensity density or total duration; keep purpose of workout.
Postpone (or move indoors)
Use when multiple warnings stack:
- HeatRisk 3-4 and/or dew point >=65°F
- poor overnight lows with repeated recovery suppression
- large early HR drift or unusual exertion mismatch
Action: move key work indoors, switch to easy aerobic, or postpone quality 24 hours.
This ladder is guidance you apply yourself, not an automatic SensAI weather feature. Use it to decide what your city and physiology call for, then request a workout change in chat if you need one. SensAI uses what you complete and how you recover when it regenerates your next weekly program.
This-week checklist for summer marathon and half-marathon blocks
Use this checklist now:
- Set your local heat dashboard (hourly dew point + HeatRisk + overnight low).47
- Schedule 2-3 key sessions only in lowest-stress windows by ZIP.
- Cap early-week heat load while acclimation ramps (Days 1-4).
- Track HR drift on every steady run and annotate route/time/weather.
- Log morning recovery trend (HRV, resting HR, sleep).
- Apply Train/Modify/Postpone daily, not emotionally.
- Protect hydration and body-mass loss on long runs (>2% loss is a red flag).3
- Consolidate in Days 11-14 before judging race-specific fitness.
Population data reinforces why this discipline matters. Across 1,258 races, Vihma et al. reported exposure distributions of 27% cold/cool, 47% neutral, 18% moderate heat, 7% high heat, and 1% extreme heat.11 Heat stress is common enough that your summer block needs a repeatable protocol, not one-off hero days.
How to use this protocol with SensAI
SensAI does not currently ingest city weather, HeatRisk, or ZIP-code forecasts to automate daily training calls. Check those inputs yourself, use the ladder above, and bring your decision into chat when you want a workout changed. Used consistently, that means:
- fewer unnecessary hard days in oppressive conditions,
- fewer missed quality sessions from over-conservative guesswork,
- and better continuity across summer build phases.
If your goal is safer, faster summer performance, this geo-adaptive protocol gives you the missing middle between rigid plans and improvisation. SensAI adds your personalized workout and recovery context, responds to changes you request in chat, and regenerates the program weekly from what you actually complete.
Continue with SensAI
- SensAI Home
- How SensAI Works
- SensAI Tools
- SensAI FAQ
- Contact SensAI Coaching
- Wearable Readiness Score Conflicts Framework
- Can You Run in Poor Air Quality? AQI + Wearable Framework
Bottom line: summer performance improves when you stop asking only “How hot is it?” and start asking “How hot is it here, and how is my body responding?” This guide gives you that decision loop; SensAI supplies personalized workout and recovery context and lets you request changes through chat.
References
Footnotes
-
Korey Stringer Institute. “Heat Acclimatization.” https://koreystringer.institute.uconn.edu/heat-acclimatization/ ↩ ↩2 ↩3
-
CDC/NIOSH. “Acclimatization.” https://www.cdc.gov/niosh/heat-stress/recommendations/acclimatization.html ↩ ↩2
-
Périard JD, Racinais S, Sawka MN. “Adaptations and mechanisms of human heat acclimation: applications for competitive athletes and sports.” Scandinavian Journal of Medicine & Science in Sports. https://pubmed.ncbi.nlm.nih.gov/25943654/ ↩ ↩2 ↩3 ↩4 ↩5 ↩6 ↩7
-
National Weather Service. “Dew Point vs. Humidity.” https://www.weather.gov/arx/why_dewpoint_vs_humidity ↩ ↩2 ↩3 ↩4
-
Ely MR, et al. “Impact of weather on marathon-running performance.” Medicine & Science in Sports & Exercise. https://pubmed.ncbi.nlm.nih.gov/17473775/ ↩ ↩2
-
National Weather Service. “What is the Heat Index?” https://www.weather.gov/ama/heatindex/ ↩
-
NWS Weather Prediction Center. “Understanding HeatRisk.” https://www.wpc.ncep.noaa.gov/heatrisk/understanding.html ↩ ↩2 ↩3
-
NOAA. “NOAA expands availability of new heat forecast tool ahead of summer.” https://www.noaa.gov/news-release/noaa-expands-availability-of-new-heat-forecast-tool-ahead-of-summer ↩ ↩2
-
Daanen HAM, Racinais S, Périard JD. “Heat acclimation decay and re-induction: a systematic review and meta-analysis.” https://pmc.ncbi.nlm.nih.gov/articles/PMC6422510/ ↩
-
Flouris AD, et al. “Changes in heart rate variability during the induction and decay of heat acclimation.” European Journal of Applied Physiology. https://pubmed.ncbi.nlm.nih.gov/24957416/ ↩
-
Vihma T, et al. “Effects of Weather Parameters on Endurance Running Performance.” https://pmc.ncbi.nlm.nih.gov/articles/PMC8677617/ ↩ ↩2
-
Garmin fēnix manual. “Heat and altitude acclimation.” https://www8.garmin.com/manuals/webhelp/fenix66s6xpro/EN-US/GUID-70386BCC-5682-4C5C-9A87-C32AF9B6473B.html ↩
-
WHOOP for Developers. “WHOOP 101.” https://developer.whoop.com/docs/whoop-101/ ↩
-
Oura. “Readiness Score.” https://ouraring.com/blog/readiness-score/ ↩